Python的图像分析方法是一种强大的数据处理技术,它利用多种算法和工具来提取、处理和分析图像数据。通过Python,我们可以方便地调用各种图像处理库,如OpenCV、PIL(Pillow)、SciPy等,进行图像的预处理、特征提取、图像分割、边缘检测等操作。此外,利用Python的机器学习库,如scikit-learn、TensorFlow等,我们还可以对图像进行更高级的分析,如目标检测、图像识别、图像分类等。SciPy是构建在Python的NumPy扩展上的数学算法和便利函数的集合。它通过向用户提供用于操作和可视化数据的高级命令和类,为交互式Python会话添加了强大的功能。有了SciPy,交互式Python会话将成为可与MATLAB、IDL、Octave、R-Lab和SciLab等系统相媲美的数据处理和系统原型环境。
Python的数字图像分析方法章节将持续3-4周的课程,包括数字图像的基础操作,图像降噪,图像分割,边缘检测,目标检测等等。本节课程我们将学习Python在数字图像分析领域的一些基础方法。
Pillow 与 PIL 库 PIL (Python Imaging Library) 是Python平台上图像处理的标准库,功能丰富,API简单易用,不过只支持到Python 2.7。
PIL官方网站:http://www.pythonware.com/products/pil/
Pillow是PIL的一个派生分支,但如今已经发展成为比PIL本身更具活力的图像处理库。
Pillow的Github主页:https://github.com/python-pillow/Pillow https://pillow.readthedocs.org/en/latest/handbook/index.html
给Python安装Pillow非常简单,使用pip或easy_install只要一行代码即可。
1
2
3
4
# 在命令行使用PIP安装: pip install Pillow # 或在命令行使用easy_install安装: easy_install Pillow
安装完成后,使用from PIL import Image就引用使用库了。如:
1
2
3
from PIL import Imageim = Image.open ("im.png" ) im.rotate(45 ).show()
使用 Image 类 PIL最重要的类是 Image class, 你可以通过多种方法创建这个类的实例;你可以从文件加载图像,或者处理其他图像, 或者从 scratch 创建。
要从文件加载图像,使用 open() 函数, 在 Image 模块:
1
2
from PIL import Imageim = Image.open ("im.png" )
加载成功将返回一个 Image 对象。 你现在可以使用示例属性检查文件内容:
1
2
3
from __future__ import print_functionprint (im.format , im.size, im.mode)
format 这个属性标识了图像来源。如果图像不是从文件读取它的值就是None。size属性是一个二元tuple,包含width和height(宽度和高度,单位都是px)。 mode 属性定义了图像通道的数量和名称,以及像素类型和深度。常见的modes 有 “L” (luminance) 表示灰度图像, “RGB” 表示真彩色图像, 以及 “CMYK” 表示出版图像。
如果文件打开错误,返回 IOError 错误。
只要你有了 Image 类的实例,你就可以通过类的方法处理图像。比如,下列方法可以显示图像:
标准的 im.show() 效率并不高,它需要保存图像到临时文件然后通过 xv 显示图像。你需要先安装 xv ,显示图像有助于调试和测试。
读写图像 PIL 模块支持大量图片格式。使用在 Image 模块的 open() 函数从磁盘读取文件。你不需要知道文件格式就能打开它,这个库能够根据文件内容自动确定文件格式。
从文件读取 1 2 fp = open ("im.png" , "rb" ) im = Image.open (fp)
从指定路径读取 1 2 3 4 from PIL import Imageimport osim = Image.open (os.path.join(os.getcwd(),"im.png" ))
要保存文件,使用 Image 类的 save() 方法。保存文件的时候文件名变得重要了。除非你指定格式,否则这个库将会以文件名的扩展名作为格式保存。
转换文件格式到JPEG 1 2 3 4 5 6 7 8 9 10 11 12 from __future__ import print_functionimport os, sysfrom PIL import Imagefor infile in sys.argv[1 :]: f, e = os.path.splitext(infile) outfile = f + ".jpg" if infile != outfile: try : Image.open (infile).convert('RGB' ).save(outfile) except IOError: print ("cannot convert" , infile)
argv是sys模块的一个全局变量,也称sys模块的一个属性!argv本身为一个list类型的对象,该对象持有的第1个元素是命令行中传入的模块名、从第2个元素开始(含),均为命令行中传入的参数!
注意:argv持有的每个元素的类型均为str(字符串)
save() 方法的第二个参数可以指定文件格式,如果你使用非标准的扩展名你必须这样做:
创建 JPEG 缩略图 1 2 3 4 5 6 7 8 9 10 11 12 13 14 15 from __future__ import print_functionimport os, sysfrom PIL import Imagesize = (128 , 128 ) for infile in sys.argv[1 :]: outfile = os.path.splitext(infile)[0 ] + ".jpg" if infile != outfile: try : im = Image.open (infile) im.thumbnail(size) im.convert("RGB" ).save(outfile, "JPEG" ) except IOError: print ("cannot create thumbnail for" , infile)
很重要的一点是这个库不会直接解码或者加载图像栅格数据。当你打开一个文件,只会读取文件头信息用来确定格式,颜色模式,大小等等,文件的剩余部分不会主动处理。这意味着打开一个图像文件的操作十分快速,跟图片大小和压缩方式无关。下面是一个简单的脚本用来快速验证大量图片。
验证图像文件 1 2 3 4 5 6 7 8 9 10 from __future__ import print_functionimport sysfrom PIL import Imagefor infile in sys.argv[1 :]: try : with Image.open (infile) as im: print (infile, im.format , "%dx%d" % im.size, im.mode) except IOError: pass
图像剪切,粘贴,合并,几何变换等 Image 类包含的方法允许你操作图像部分选区。使用:py:meth:~PIL.Image.Image.crop 方法获取图像的一个子矩形选区。
从图像中复制出一个矩形选区 1 2 box = (100 , 100 , 400 , 400 ) region = im.crop(box)
矩形选区有一个4元元组定义,分别表示左、上、右、下的坐标。这个库以左上角为坐标原点,单位是px,所以上诉代码复制了一个 300x300 pixels 的矩形选区。这个选区现在可以被处理并且粘贴到原图。
处理复制的矩形选区并粘贴到原图 1 2 region = region.transpose(Image.ROTATE_180) im.paste(region, box)
当你粘贴矩形选区的时候必须保证尺寸一致。此外,矩形选区不能在图像外。然而你不必保证矩形选区和原图的颜色模式一致,因为矩形选区会被自动转换颜色(参看下面的 颜色变换 部分),下面是一个例子:
1 2 3 4 5 6 7 8 9 10 11 12 13 14 15 def roll (image, delta ): "Roll an image sideways" xsize, ysize = image.size delta = delta % xsize if delta == 0 : return image part1 = image.crop((0 , 0 , delta, ysize)) part2 = image.crop((delta, 0 , xsize, ysize)) image.paste(part2, (0 , 0 , xsize-delta, ysize)) image.paste(part1, (xsize-delta, 0 , xsize, ysize)) return image
分离和合并颜色通道 1 2 r, g, b = im.split() im = Image.merge("RGB" , (b, g, r))
注意,对于单通道图像,split()返回图像本身。
几何变换 PIL.Image.Image类包含了resize()和rotate()方法。前者接受一个元组,给出新的大小,后者接受以逆时针为单位的角度。
1 2 3 out = im.resize((128 , 128 )) out = im.rotate(45 ) im1 = im1.rotate(90 , PIL.Image.NEAREST, expand = 1 )
要以90度的步骤旋转图像,您可以使用rotate()方法或transpose()方法。后者也可用于围绕其水平或垂直轴翻转图像。
1 2 3 4 5 out = im.transpose(Image.FLIP_LEFT_RIGHT) out = im.transpose(Image.FLIP_TOP_BOTTOM) out = im.transpose(Image.ROTATE_90) out = im.transpose(Image.ROTATE_180) out = im.transpose(Image.ROTATE_270)
transpose()方法和相应的rotate()方法在性能和结果上没有区别。
颜色变换 Python成像库允许您使用convert()方法在不同色彩表示之间转换图像。
1 im = Image.open ("im.png" ).convert("L" )
该库支持每种受支持的模式与“L”和“RGB”模式之间的转换。要在其他模式之间进行转换,可能必须使用中间图像(通常是“RGB”图像)。
随堂练习
构建一张PNG格式图像,读取该图片,左右翻转后,侧向平移50个像素,沿顺时针方向旋转70度后保留完整的画幅尺寸,输出为JPEG格式。
如何将PIL图像转换为NumPy数组? 从以下URL导入图像并将其转换为numpy数组。https://upload.wikimedia.org/wikipedia/commons/8/8b/Denali_Mt_McKinley.jpg ‘
1 2 3 4 5 6 7 8 9 10 11 12 13 14 15 16 17 18 19 from io import BytesIOfrom PIL import Imageimport PIL, requestsURL = 'https://upload.wikimedia.org/wikipedia/commons/8/8b/Denali_Mt_McKinley.jpg' response = requests.get(URL) I = Image.open (BytesIO(response.content)) I = I.resize([150 ,150 ]) arr = np.asarray(I) im = PIL.Image.fromarray(np.uint8(arr))
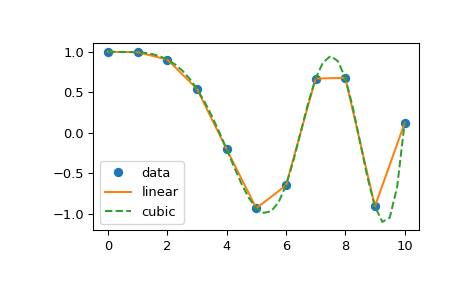
插值 (scipy.interpolate) 一维插值 (interp1d) 这个 interp1d 中的类 scipy.interpolate 是一种基于固定数据点创建函数的便捷方法,可以使用线性插值在给定数据定义的域内的任何位置计算该函数。通过传递组成数据的一维向量来创建此类的实例。此类的实例定义了一个 __call__ 方法,因此可以将其视为在已知数据值之间进行插值以获得未知值的函数(它还具有用于帮助的文档字符串)。边界处的行为可以在实例化时指定。下面的示例演示了它在线性样条插值和三次样条插值中的用法:
1 2 3 4 5 6 7 8 9 10 11 12 13 from scipy.interpolate import interp1dimport matplotlib.pyplot as pltimport numpy as npx = np.linspace(0 , 10 , num=11 , endpoint=True ) y = np.cos(-x**2 /9.0 ) f = interp1d(x, y) f2 = interp1d(x, y, kind='cubic' ) xnew = np.linspace(0 , 10 , num=41 , endpoint=True ) plt.plot(x, y, 'o' , xnew, f(xnew), '-' , xnew, f2(xnew), '--' ) plt.legend(['data' , 'linear' , 'cubic' ], loc='best' ) plt.show()
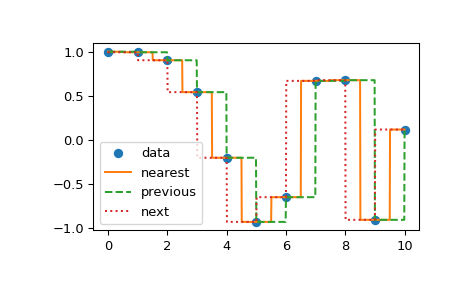
插值 interp1d 的方法常见的可以有nearest, previous以及next,其中它们返回沿x轴最近的点、上一个点或下一个点。最近的和次要的可以被认为是因果插值过滤的特例。下面的示例使用与上一个示例中相同的数据演示它们的用法:
1
2
3
4
5
6
7
8
9
10
11
12
13
14
15
from scipy.interpolate import interp1dimport matplotlib.pyplot as pltimport numpy as npx = np.linspace(0 , 10 , num=11 , endpoint=True ) y = np.cos(-x**2 /9.0 ) f1 = interp1d(x, y, kind='nearest' ) f2 = interp1d(x, y, kind='previous' ) f3 = interp1d(x, y, kind='next' ) xnew = np.linspace(0 , 10 , num=1001 , endpoint=True ) plt.plot(x, y, 'o' ) plt.plot(xnew, f1(xnew), '-' , xnew, f2(xnew), '--' , xnew, f3(xnew), ':' ) plt.legend(['data' , 'nearest' , 'previous' , 'next' ], loc='best' ) plt.show()
多变量数据插值 (griddata) 例如,假设您具有基础函数的多维数据 $F(x,y)$,你只知道若干个点上的值 $[(x[i],y[i])]$,它们不会形成规则的网格。
假设我们要对二维函数 $F(x,y)$ 进行插值:
1 2 3 4 5 6 import numpy as npdef func (x, y ): return x*(1 -x)*np.cos(4 *np.pi*x) * np.sin(4 *np.pi*y**2 )**2 grid_x, grid_y = np.mgrid[0 :1 :100j , 0 :1 :200j ]
但我们只知道它在1000个数据点的值:
1 2 points = np.random.random((1000 , 2 )) values = func(points[:,0 ], points[:,1 ])
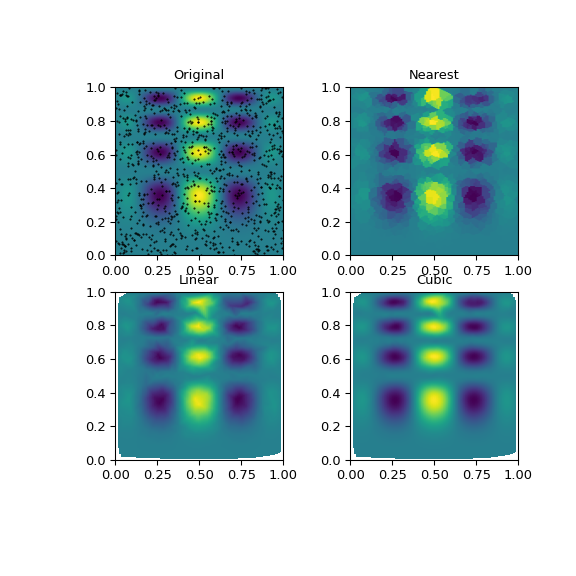
这可以通过以下方式完成 griddata –下面我们将尝试所有的插值方法:
1 2 3 4 5 from scipy.interpolate import griddatagrid_z0 = griddata(points, values, (grid_x, grid_y), method='nearest' ) grid_z1 = griddata(points, values, (grid_x, grid_y), method='linear' ) grid_z2 = griddata(points, values, (grid_x, grid_y), method='cubic' )
可以看到,所有方法都在一定程度上重现了准确的结果,但对于此光滑函数,三次样条插值提供了最好的结果:
1 2 3 4 5 6 7 8 9 10 11 12 13 14 15 16 import matplotlib.pyplot as pltplt.subplot(221 ) plt.imshow(func(grid_x, grid_y).T, extent=(0 ,1 ,0 ,1 ), origin='lower' ,cmap = 'hsv' ) plt.plot(points[:,0 ], points[:,1 ], 'k.' , ms=1 ) plt.title('Original' ) plt.subplot(222 ) plt.imshow(grid_z0.T, extent=(0 ,1 ,0 ,1 ), origin='lower' ) plt.title('Nearest' ) plt.subplot(223 ) plt.imshow(grid_z1.T, extent=(0 ,1 ,0 ,1 ), origin='lower' ) plt.title('Linear' ) plt.subplot(224 ) plt.imshow(grid_z2.T, extent=(0 ,1 ,0 ,1 ), origin='lower' ) plt.title('Cubic' ) plt.gcf().set_size_inches(6 , 6 ) plt.show()
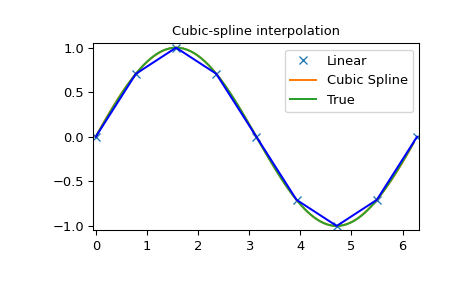
样条插值 一维中的样条插值:程序化 1 2 3 4 5 6 7 8 9 10 11 12 13 14 15 16 17 18 19 20 21 22 23 import numpy as npimport matplotlib.pyplot as pltfrom scipy import interpolatex = np.arange(0 , 2 *np.pi+np.pi/4 , np.pi/4 ) y = np.sin(x) tck = interpolate.splrep(x, y, s=0 ) xnew = np.arange(0 , 2 *np.pi, np.pi/50 ) ynew = interpolate.splev(xnew, tck, der=0 ) plt.figure() plt.plot(x, y, 'x' , xnew, ynew, xnew, np.sin(xnew), x, y, 'b' ) plt.legend(['Linear' , 'Cubic Spline' , 'True' ]) plt.axis([-0.05 , 6.33 , -1.05 , 1.05 ]) plt.title('Cubic-spline interpolation' ) plt.show()
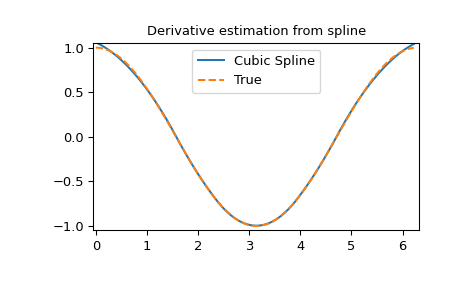
样条的导数 1 2 3 4 5 6 7 yder = interpolate.splev(xnew, tck, der=1 ) plt.figure() plt.plot(xnew, yder, xnew, np.cos(xnew),'--' ) plt.legend(['Cubic Spline' , 'True' ]) plt.axis([-0.05 , 6.33 , -1.05 , 1.05 ]) plt.title('Derivative estimation from spline' ) plt.show()
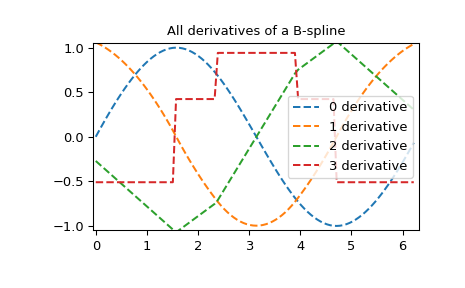
样条的所有导数 1 2 3 4 5 6 7 8 9 yders = interpolate.spalde(xnew, tck) plt.figure() for i in range (len (yders[0 ])): plt.plot(xnew, [d[i] for d in yders], '--' , label=f"{i} derivative" ) plt.legend() plt.axis([-0.05 , 6.33 , -1.05 , 1.05 ]) plt.title('All derivatives of a B-spline' ) plt.show()
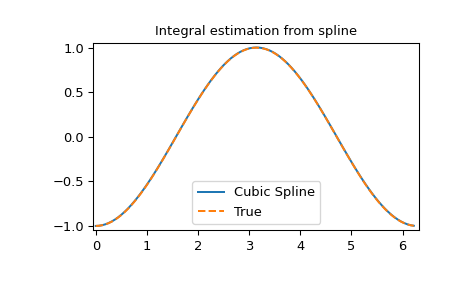
样条的积分 1 2 3 4 5 6 7 8 9 10 11 12 13 14 def integ (x, tck, constant=-1 ): x = np.atleast_1d(x) out = np.zeros(x.shape, dtype=x.dtype) for n in range (len (out)): out[n] = interpolate.splint(0 , x[n], tck) out += constant return out yint = integ(xnew, tck) plt.figure() plt.plot(xnew, yint, xnew, -np.cos(xnew), '--' ) plt.legend(['Cubic Spline' , 'True' ]) plt.axis([-0.05 , 6.33 , -1.05 , 1.05 ]) plt.title('Integral estimation from spline' ) plt.show()
样条的根
1 2 interpolate.sproot(tck) array([3.1416 ])
请注意, sproot 在近似区间的边缘找不到明显的解。如果我们在稍微大一点的间隔上定义样条,我们可以恢复两个根:
1 2 3 4 5 x = np.linspace(-np.pi/4 , 2. *np.pi + np.pi/4 , 21 ) y = np.sin(x) tck = interpolate.splrep(x, y, s=0 ) interpolate.sproot(tck) array([0. , 3.1416 ])
参数样条
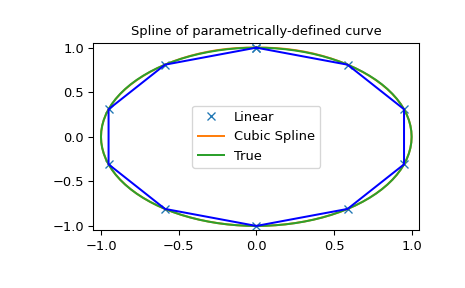
1 2 3 4 5 6 7 8 9 10 11 12 t = np.arange(0 , 1.1 , .1 ) x = np.sin(2 *np.pi*t) y = np.cos(2 *np.pi*t) tck, u = interpolate.splprep([x, y], s=0 ) unew = np.arange(0 , 1.01 , 0.01 ) out = interpolate.splev(unew, tck) plt.figure() plt.plot(x, y, 'x' , out[0 ], out[1 ], np.sin(2 *np.pi*unew), np.cos(2 *np.pi*unew), x, y, 'b' ) plt.legend(['Linear' , 'Cubic Spline' , 'True' ]) plt.axis([-1.05 , 1.05 , -1.05 , 1.05 ]) plt.title('Spline of parametrically-defined curve' ) plt.show()
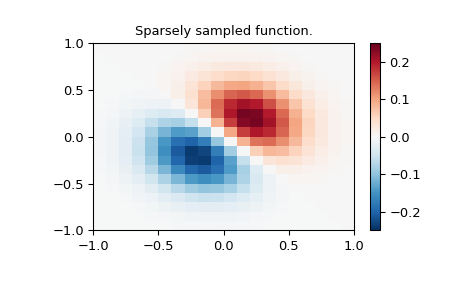
1 2 3 4 5 6 7 8 9 10 11 12 13 14 15 import numpy as npfrom scipy import interpolateimport matplotlib.pyplot as pltx_edges, y_edges = np.mgrid[-1 :1 :21j , -1 :1 :21j ] x = x_edges[:-1 , :-1 ] + np.diff(x_edges[:2 , 0 ])[0 ] / 2. y = y_edges[:-1 , :-1 ] + np.diff(y_edges[0 , :2 ])[0 ] / 2. z = (x+y) * np.exp(-6.0 *(x*x+y*y)) plt.figure() lims = dict (cmap='RdBu_r' , vmin=-0.25 , vmax=0.25 ) plt.pcolormesh(x_edges, y_edges, z, shading='flat' , **lims) plt.colorbar() plt.title("Sparsely sampled function." ) plt.show()
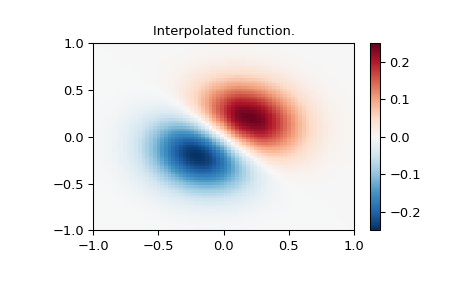
新的70x70网格上的插值函数
1 2 3 4 5 6 7 8 9 10 xnew_edges, ynew_edges = np.mgrid[-1 :1 :71j , -1 :1 :71j ] xnew = xnew_edges[:-1 , :-1 ] + np.diff(xnew_edges[:2 , 0 ])[0 ] / 2. ynew = ynew_edges[:-1 , :-1 ] + np.diff(ynew_edges[0 , :2 ])[0 ] / 2. tck = interpolate.bisplrep(x, y, z, s=0 ) znew = interpolate.bisplev(xnew[:,0 ], ynew[0 ,:], tck) plt.figure() plt.pcolormesh(xnew_edges, ynew_edges, znew, shading='flat' , **lims) plt.colorbar() plt.title("Interpolated function." ) plt.show()
随堂练习
定义一个三次二元函数,在[-10,10] x [-10,10]定义域范围内随机生成1000个点,并计算函数值。通过插值方法获取每[0.01 x 0.01]间隔的网格点处的函数值。
空间数据结构和算法 (scipy.spatial) SciPy通过利用Qhull类库,spatial可以计算三角剖分、Voronoi图和凸包等等。此外,它还包含 KDTree 最近邻点查询的实现,以及各种度量中距离计算的实用程序。
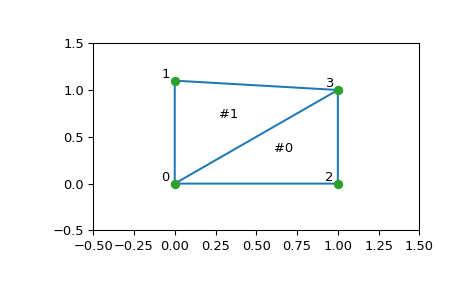
Delaunay三角测量 Delaunay三角剖分是将一组点细分为一组不重叠的三角形,这样任何三角形的外接圆内都没有点。在实践中,这样的三角剖分往往会避免带有小角度的三角形。
可以使用以下方法计算Delaunay三角剖分 scipy.spatial 具体如下:
1 2 3 4 from scipy.spatial import Delaunayimport numpy as nppoints = np.array([[0 , 0 ], [0 , 1.1 ], [1 , 0 ], [1 , 1 ]]) tri = Delaunay(points)
我们可以把它形象化:
1 2 3 4 5 6 7 8 9 10 11 import matplotlib.pyplot as pltplt.triplot(points[:,0 ], points[:,1 ], tri.simplices) plt.plot(points[:,0 ], points[:,1 ], 'o' ) for j, p in enumerate (points): plt.text(p[0 ]-0.03 , p[1 ]+0.03 , j, ha='right' ) for j, s in enumerate (tri.simplices): p = points[s].mean(axis=0 ) plt.text(p[0 ], p[1 ], '#%d' % j, ha='center' ) plt.xlim(-0.5 , 1.5 ); plt.ylim(-0.5 , 1.5 ) plt.show()
三角剖分的结构按以下方式编码: simplices 属性包含 points 组成三角形的数组。例如:
1 2 3 4 5 6 7 8 i = 1 tri.simplices[i,:] points[tri.simplices[i,:]]
此外,还可以找到相邻三角形:
1 2 tri.neighbors[i] # array([-1, 0, -1], dtype=int32)
这告诉我们这个三角形有#0号三角形作为邻居,但没有其他邻居。此外,它还告诉我们邻居0与三角形的顶点1相对:
1 2 points[tri.simplices[i, 1 ]]
事实上,从数字上,我们可以看到情况是这样的。
Qhull还可以对高维点集执行细分以简化(例如,在3-D中细分为四面体)。
共面点
重要的是要注意到,不是 all 由于形成三角剖分的数值精度问题,点必然显示为三角剖分的顶点。请考虑具有重复点的上述内容:
1 2 3 4 points = np.array([[0 , 0 ], [0 , 1 ], [1 , 0 ], [1 , 1 ], [1 , 1 ]]) tri = Delaunay(points) np.unique(tri.simplices.ravel()) array([0 , 1 , 2 , 3 ], dtype=int32)
请注意,重复的点#4不会作为三角剖分的顶点出现。这件事已被记录在案:
1 2 tri.coplanar array([[4 , 0 , 3 ]], dtype=int32)
这意味着点4位于三角形0和顶点3附近,但不包括在三角剖分中。
请注意,这种退化不仅可能是因为重复的点,也可能是由于更复杂的几何原因,即使在乍看起来表现良好的点集中也是如此。
但是,Qhull具有“qj”选项,该选项指示它随机扰乱输入数据,直到解决退化问题:
1 2 3 4 5 6 7 8 9 10 11 12 13 14 tri = Delaunay(points, qhull_options="QJ Pp" ) points[tri.simplices] array([[[1 , 0 ], [1 , 1 ], [0 , 0 ]], [[1 , 1 ], [1 , 1 ], [1 , 0 ]], [[1 , 1 ], [0 , 1 ], [0 , 0 ]], [[0 , 1 ], [1 , 1 ], [1 , 1 ]]])
出现了两个新的三角形。然而,我们看到它们是退化的,面积为零。
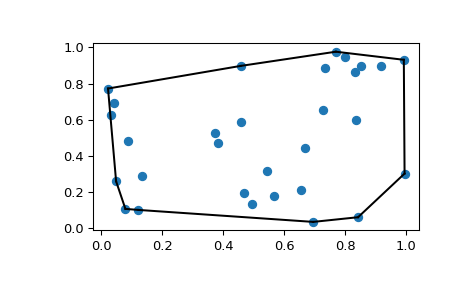
凸包 凸包是包含给定点集中所有点的最小凸对象。
这些值可以通过中的qhull包装器进行计算。 scipy.spatial 具体如下:
1 2 3 4 from scipy.spatial import ConvexHullrng = np.random.default_rng() points = rng.random((30 , 2 )) hull = ConvexHull(points)
凸包被表示为一组N个1-D简化,在2-D中表示线段。存储方案与上面讨论的Delaunay三角剖分中的简化完全相同。
我们可以举例说明上述结果:
1 2 3 4 5 import matplotlib.pyplot as pltplt.plot(points[:,0 ], points[:,1 ], 'o' ) for simplex in hull.simplices: plt.plot(points[simplex,0 ], points[simplex,1 ], 'k-' ) plt.show()
同样的情况也可以通过以下方式实现 scipy.spatial.convex_hull_plot_2d。
Voronoi图 Voronoi图是将空间细分为一组给定点的最近邻域。
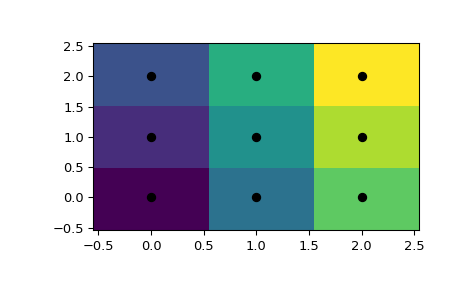
使用以下两种方法可以接近此对象scipy.spatial 。首先,可以使用 KDTree 要回答“哪个点最接近这个点”的问题,并这样定义区域:
1 2 3 4 5 6 from scipy.spatial import KDTreepoints = np.array([[0 , 0 ], [0 , 1 ], [0 , 2 ], [1 , 0 ], [1 , 1 ], [1 , 2 ], [2 , 0 ], [2 , 1 ], [2 , 2 ]]) tree = KDTree(points) tree.query([0.1 , 0.1 ]) (0.14142135623730953 , 0 )
所以重点是 (0.1, 0.1) 属于区域 0 。在颜色方面:
1 2 3 4 5 6 7 8 9 10 11 x = np.linspace(-0.5 , 2.5 , 31 ) y = np.linspace(-0.5 , 2.5 , 33 ) xx, yy = np.meshgrid(x, y) xy = np.c_[xx.ravel(), yy.ravel()] import matplotlib.pyplot as pltdx_half, dy_half = np.diff(x[:2 ])[0 ] / 2. , np.diff(y[:2 ])[0 ] / 2. x_edges = np.concatenate((x - dx_half, [x[-1 ] + dx_half])) y_edges = np.concatenate((y - dy_half, [y[-1 ] + dy_half])) plt.pcolormesh(x_edges, y_edges, tree.query(xy)[1 ].reshape(33 , 31 ), shading='flat' ) plt.plot(points[:,0 ], points[:,1 ], 'ko' ) plt.show()
然而,这并没有给出作为几何对象的Voronoi图。
线和点的表示可以通过中的qhull包装器再次获得 scipy.spatial:
1 2 3 4 5 6 7 from scipy.spatial import Voronoivor = Voronoi(points) vor.vertices array([[0.5 , 0.5 ], [0.5 , 1.5 ], [1.5 , 0.5 ], [1.5 , 1.5 ]])
Voronoi顶点表示形成Voronoi区域的多边形边的点集。在本例中,有9个不同的区域:
1 2 vor.regions [[], [-1 , 0 ], [-1 , 1 ], [1 , -1 , 0 ], [3 , -1 , 2 ], [-1 , 3 ], [-1 , 2 ], [0 , 1 , 3 , 2 ], [2 , -1 , 0 ], [3 , -1 , 1 ]]
负值 -1 再次表示无穷远处的一个点。事实上,只有一个地区, [0, 1, 3, 2],是有界的。请注意,由于与上面的Delaunay三角剖分中类似的数值精度问题,Voronoi区域可能比输入点少。
将分隔区域的脊(二维中的线)描述为与凸面壳片类似的简化集合:
1 2 vor.ridge_vertices [[-1 , 0 ], [-1 , 0 ], [-1 , 1 ], [-1 , 1 ], [0 , 1 ], [-1 , 3 ], [-1 , 2 ], [2 , 3 ], [-1 , 3 ], [-1 , 2 ], [1 , 3 ], [0 , 2 ]]
这些数字表示组成线段的Voronoi顶点的索引。 -1 又是一个无穷远的点-12条直线中只有4条是有界线段,而其他的延伸到无穷远。
Voronoi山脊垂直于输入点之间绘制的线。还记录了每个脊对应的两个点:
1 2 3 4 5 6 7 8 9 10 11 12 13 vor.ridge_points array([[0 , 3 ], [0 , 1 ], [2 , 5 ], [2 , 1 ], [1 , 4 ], [7 , 8 ], [7 , 6 ], [7 , 4 ], [8 , 5 ], [6 , 3 ], [4 , 5 ], [4 , 3 ]], dtype=int32)
这些信息加在一起,足以构成完整的图表。
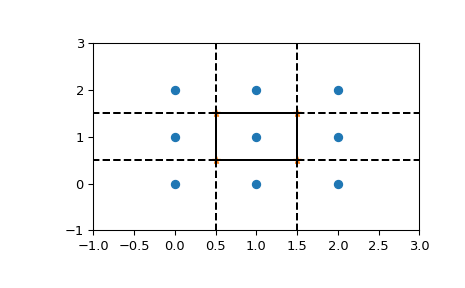
我们可以把它画成如下图。首先,点和Voronoi顶点:
1 2 3 plt.plot(points[:, 0 ], points[:, 1 ], 'o' ) plt.plot(vor.vertices[:, 0 ], vor.vertices[:, 1 ], '*' ) plt.xlim(-1 , 3 ); plt.ylim(-1 , 3 )
绘制有限线段与绘制凸壳一样,但现在我们必须注意无限边:
1 2 3 4 for simplex in vor.ridge_vertices: simplex = np.asarray(simplex) if np.all (simplex >= 0 ): plt.plot(vor.vertices[simplex, 0 ], vor.vertices[simplex, 1 ], 'k-' )
延伸到无穷远的山脊需要稍微小心一点:
1 2 3 4 5 6 7 8 9 10 11 12 13 center = points.mean(axis=0 ) for pointidx, simplex in zip (vor.ridge_points, vor.ridge_vertices): simplex = np.asarray(simplex) if np.any (simplex < 0 ): i = simplex[simplex >= 0 ][0 ] t = points[pointidx[1 ]] - points[pointidx[0 ]] t = t / np.linalg.norm(t) n = np.array([-t[1 ], t[0 ]]) midpoint = points[pointidx].mean(axis=0 ) far_point = vor.vertices[i] + np.sign(np.dot(midpoint - center, n)) * n * 100 plt.plot([vor.vertices[i,0 ], far_point[0 ]], [vor.vertices[i,1 ], far_point[1 ]], 'k--' ) plt.show()
也可以使用以下命令创建此图 scipy.spatial.voronoi_plot_2d 。
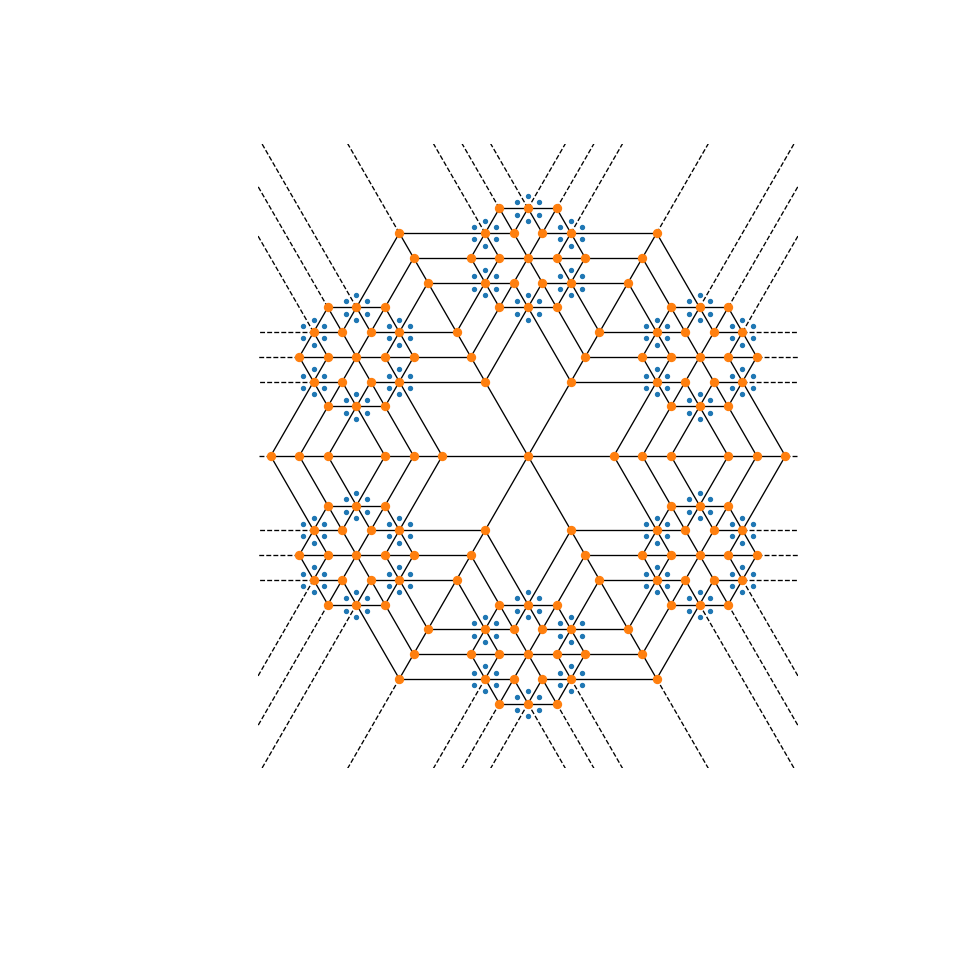
Vornoi图可以用来创作有趣的创作艺术。尝试使用此设置 mandala 函数来创建您自己的!
1 2 3 4 5 6 7 8 9 10 11 12 13 14 15 16 17 18 19 20 21 22 23 24 25 26 27 28 29 30 31 32 33 34 35 36 37 38 39 40 41 42 43 44 45 46 47 48 49 50 51 52 53 54 55 56 57 58 59 60 61 62 63 import numpy as npfrom scipy import spatialimport matplotlib.pyplot as pltdef mandala (n_iter, n_points, radius ): """Creates a mandala figure using Voronoi tesselations. Parameters ---------- n_iter : int Number of iterations, i.e. how many times the equidistant points will be generated. n_points : int Number of points to draw per iteration. radius : scalar The radial expansion factor. Returns ------- fig : matplotlib.Figure instance Notes ----- This code is adapted from the work of Audrey Roy Greenfeld [1]_ and Carlos Focil-Espinosa [2]_, who created beautiful mandalas with Python code. That code in turn was based on Antonio Sánchez Chinchón's R code [3]_. References ---------- .. [1] https://www.codemakesmehappy.com/2019/09/voronoi-mandalas.html .. [2] https://github.com/CarlosFocil/mandalapy .. [3] https://github.com/aschinchon/mandalas """ fig = plt.figure(figsize=(10 , 10 )) ax = fig.add_subplot(111 ) ax.set_axis_off() ax.set_aspect('equal' , adjustable='box' ) angles = np.linspace(0 , 2 *np.pi * (1 - 1 /n_points), num=n_points) + np.pi/2 xy = np.array([[0 , 0 ]]) for k in range (n_iter): t1 = np.array([]) t2 = np.array([]) for i in range (xy.shape[0 ]): t1 = np.append(t1, xy[i, 0 ] + radius**k * np.cos(angles)) t2 = np.append(t2, xy[i, 1 ] + radius**k * np.sin(angles)) xy = np.column_stack((t1, t2)) spatial.voronoi_plot_2d(spatial.Voronoi(xy), ax=ax) return fig n_iter = 3 n_points = 6 radius = 4 fig = mandala(n_iter, n_points, radius) plt.show()

