Python 在科研中的应用 11:Python 环境下的科研论文绘图

在Python中进行科研论文绘图,有几个常用的库可以帮助你实现高质量的图表绘制,以满足学术期刊的要求。Matplotlib是Python中一个非常流行的绘图库,它提供了丰富的功能来创建各种图表。但是,默认的Matplotlib样式可能不符合某些期刊的特定要求。为了解决这个问题,可以使用自定义的样式或者样式库来调整图表的外观。SciencePlots是一个专门为科研图表设计的样式库,它提供了多种符合不同期刊发表要求的主题样式。你可以使用这个库来快速设置图表的样式,以满足期刊的标准。

本文总结了 Matplotlib 以及 Seaborn 用的最多的50个图形,掌握这些图形的绘制,对于数据分析的可视化有莫大的作用,强烈推荐大家阅读后续内容。来源:https://www.machinelearningplus.com/plots/top-50-matplotlib-visualizations-the-master-plots-python/

本文所使用示例数据链接:https://pan.baidu.com/s/15utfb0uuPu32YHv76S4WUw, 提取码:kn6p

有效图表的重要特征

  • 在不歪曲事实的情况下传达正确和必要的信息。
  • 设计简单,您不必太费力就能理解它。
  • 从审美角度支持信息而不是掩盖信息。
  • 信息没有超负荷。

环境配置

在代码运行前先引入下面的设置内容。 当然,单独的图表,可以重新设置显示要素。其中设置了不显示warnings(由于版本变动导致的函数变动),图片以嵌入式方式展示。

1
2
3
4
5
6
7
8
9
10
11
12
13
14
15
16
17
18
19
20
21
22
23
24
25
import numpy as np
import pandas as pd
import matplotlib as mpl
import matplotlib.pyplot as plt
import seaborn as sns
import warnings; warnings.filterwarnings(action='once')

# set the fontsize and some other elements
large = 22; med = 16; small = 12
params = {'axes.titlesize': large,
'legend.fontsize': med,
'figure.figsize': (16, 10),
'axes.labelsize': med,
'xtick.labelsize': med,
'ytick.labelsize': med,
'figure.titlesize': large}
plt.rcParams.update(params)
# plt.style.use('seaborn-whitegrid')
sns.set_style("white")

# Print Version
print(mpl.__version__)
print(sns.__version__)
3.6.2
0.12.1

关联 (Correlation)

关联图表用于可视化2个或更多变量之间的关系。 也就是说,一个变量如何相对于另一个变化。

点线图(Scatter and line plot)

1
2
3
4
5
6
7
8
9
10
11
12
13
14
15
16
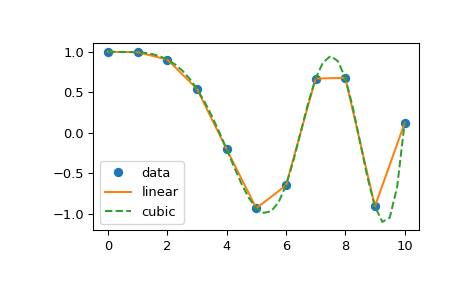
from scipy.interpolate import interp1d
import matplotlib.pyplot as plt
import numpy as np

x = np.linspace(0, 10, num=11, endpoint=True)
y = np.cos(-x**2/9.0)
f = interp1d(x, y)
f2 = interp1d(x, y, kind='cubic')
xnew = np.linspace(0, 10, num=41, endpoint=True)

plt.plot(x, y, 'o', xnew, f(xnew), '-', xnew, f2(xnew), '--')
plt.legend(['data', 'linear', 'cubic'], loc='best')
plt.xlabel('X-axis')
plt.ylabel('Y-axis')
plt.title('Multiple Lines Plot')
plt.show()

plt.plot()函数

函数matplotlib.pyplot.plot()将多组数据对绘制为点线图,形如:

1
2
3
4
plot(x, y, color='green', marker='o', linestyle='dashed',linewidth=2, markersize=12)
# Plot y versus x as lines and/or markers.

plot(x,y,data=obj)

其中

  • x,y表示需要绘制的自变量与应变量;
  • color='green'可以指定该组数据绘制的颜色,可选项包括b g r c m y k w,详见此处说明文档
  • Marker='o'表示绘制点的形状,可选项包括. , o v ^ < > 1 2 3 4 8 s p P * h H + x X D d | _
  • linestyle = 'dashed'表示线的形状,可选项包括- -- -. :

一种比较特殊的写法是把这些标识组合在一起,如:

1
2
3
4
5
'b'    # blue markers with default shape
'or' # red circles
'-g' # green solid line
'--' # dashed line with default color
'^k:' # black triangle_up markers connected by a dotted line

单自变量多因变量的情况

1
2
3
4
5
6
7
8
9
10
11
12
13
from scipy.interpolate import interp1d
import matplotlib.pyplot as plt
import numpy as np

x = [1, 2, 3]
y = np.array([[1, 2], [3, 4], [5, 6]])
plt.plot(x, y,'o-')
# is equivalent to:
#
# for col in range(y.shape[1]):
# plt.plot(x, y[:, col])

plt.show()

稍复杂些的情况

1
2
3
4
5
6
7
8
9
10
11
12
13
14
15
16
17
18
19
20
21
22
23
import matplotlib.pyplot as plt
import numpy as np

# Fixing random state for reproducibility
np.random.seed(19680801)


N = 100
r0 = 0.6
x = 0.9 * np.random.rand(N)
y = 0.9 * np.random.rand(N)
area = (20 * np.random.rand(N))**2 # 0 to 10 point radii
c = np.sqrt(area)
r = np.sqrt(x ** 2 + y ** 2)
area1 = np.ma.masked_where(r < r0, area)
area2 = np.ma.masked_where(r >= r0, area)
plt.scatter(x, y, s=area1, marker='^', c=c)
plt.scatter(x, y, s=area2, marker='o', c=c)
# Show the boundary between the regions:
theta = np.arange(0, np.pi / 2, 0.01)
plt.plot(r0 * np.cos(theta), r0 * np.sin(theta))

plt.show()

plt.scatter()函数

1
2
3
matplotlib.pyplot.scatter(x, y, s=None, c=None, marker=None, cmap=None, norm=None, vmin=None, vmax=None,
alpha=None, linewidths=None, *, edgecolors=None, plotnonfinite=False, data=None, **kwargs)
# A scatter plot of y vs. x with varying marker size and/or color.

其中,

  • x,y:指定自变量与应变量;
  • s:标记点的尺寸,如不指定默认值为rcParams['lines.markersize'] ** 2
  • c:标记点的颜色;
  • marker:标记的形状类别;
  • cmap:用于将标量数据映射到颜色的Colormap实例或已注册的Colormap名称。如果c为RGB(A),则忽略此参数。
  • norm:在使用cmap映射到颜色之前,将标量数据缩放到[0,1]范围的归一化方法。默认情况下,使用线性缩放,将最低值映射为0,最高值映射为1。
  • alpha:不透明度,取值在[0,1]。
1
2
3
4
5
6
7
8
9
10
11
12
13
14
15
import matplotlib.pyplot as plt
import numpy as np

# Fixing random state for reproducibility
np.random.seed(19680801)


N = 50
x = np.random.rand(N)
y = np.random.rand(N)
colors = np.random.rand(N)
area = (30 * np.random.rand(N))**2 # 0 to 15 point radii

plt.scatter(x, y, s=area, c=colors, alpha=0.5)
plt.show()

极图

1
2
3
4
5
6
7
8
9
10
11
12
13
14
15
16
import matplotlib.pyplot as plt
import numpy as np

# Fixing random state for reproducibility
np.random.seed(19680801)

# Compute areas and colors
N = 150
r = 2 * np.random.rand(N)
theta = 2 * np.pi * np.random.rand(N)
area = 200 * r**2
colors = theta

fig = plt.figure()
ax = fig.add_subplot(projection='polar')
c = ax.scatter(theta, r, c=colors, s=area, cmap='hsv', alpha=0.75)
1
2
3
4
5
6
fig = plt.figure()
ax = fig.add_subplot(projection='polar')
c = ax.scatter(theta, r, c=colors, s=area, cmap='hsv', alpha=0.75)

ax.set_rorigin(-2.5)
ax.set_theta_zero_location('W', offset=10)
1
2
3
4
5
6
7
8
fig = plt.figure()
ax = fig.add_subplot(projection='polar')
c = ax.scatter(theta, r, c=colors, s=area, cmap='hsv', alpha=0.75)

ax.set_thetamin(45)
ax.set_thetamax(135)

plt.show()

二维信号的可视化

1
2
3
4
5
6
7
8
9
10
11
12
13
14
15
16
17
18
19
20
21
import numpy as np

def func(x, y):
return x*(1-x)*np.cos(4*np.pi*x) * np.sin(4*np.pi*y**2)**2

grid_x, grid_y = np.mgrid[0:1:100j, 0:1:200j]

np.mgrid[0:5, 0:5]
array([[[0, 0, 0, 0, 0],
[1, 1, 1, 1, 1],
[2, 2, 2, 2, 2],
[3, 3, 3, 3, 3],
[4, 4, 4, 4, 4]],
[[0, 1, 2, 3, 4],
[0, 1, 2, 3, 4],
[0, 1, 2, 3, 4],
[0, 1, 2, 3, 4],
[0, 1, 2, 3, 4]]])

np.mgrid[-1:1:5j]
array([-1. , -0.5, 0. , 0.5, 1. ])

但我们只知道它在1000个数据点的值:

1
2
points = np.random.random((1000, 2))
values = func(points[:,0], points[:,1])

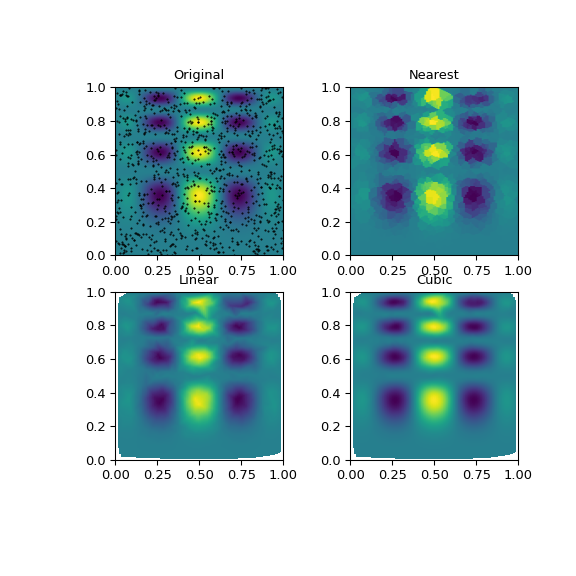
这可以通过以下方式完成 griddata –下面我们将尝试所有的插值方法:

1
2
3
4
5
from scipy.interpolate import griddata

grid_z0 = griddata(points, values, (grid_x, grid_y), method='nearest')
grid_z1 = griddata(points, values, (grid_x, grid_y), method='linear')
grid_z2 = griddata(points, values, (grid_x, grid_y), method='cubic')

可以看到,所有方法都在一定程度上重现了准确的结果,但对于此光滑函数,三次样条插值提供了最好的结果:

1
2
3
4
5
6
7
8
9
10
11
12
13
14
15
16
import matplotlib.pyplot as plt
plt.subplot(221)
plt.imshow(func(grid_x, grid_y).T, extent=(0,1,0,1), origin='lower',cmap = 'jet')
plt.plot(points[:,0], points[:,1], 'k.', ms=1)
plt.title('Original')
plt.subplot(222)
plt.imshow(grid_z0.T, extent=(0,1,0,1), origin='lower')
plt.title('Nearest')
plt.subplot(223)
plt.imshow(grid_z1.T, extent=(0,1,0,1), origin='lower')
plt.title('Linear')
plt.subplot(224)
plt.imshow(grid_z2.T, extent=(0,1,0,1), origin='lower')
plt.title('Cubic')
plt.gcf().set_size_inches(6, 6)
plt.show()

散点图(Scatter plot)

散点图是用于研究两个变量之间关系的经典的和基本的图表。 如果数据中有多个组,则可能需要以不同颜色可视化每个组。 在 matplotlib 中,您可以使用 plt.scatter() 方便地执行此操作。

1
2
3
4
5
6
7
8
9
10
11
12
13
14
15
16
17
18
19
20
21
22
23
24
# Import dataset 
midwest = pd.read_csv('midwest_filter.csv')

# Prepare Data
# Create as many colors as there are unique midwest['category']
categories = np.unique(midwest['category'])
colors = [plt.cm.tab10(i/float(len(categories)-1)) for i in range(len(categories))]

# Draw Plot for Each Category
plt.figure(figsize=(16, 10), dpi= 80, facecolor='w', edgecolor='k')

for i, category in enumerate(categories):
plt.scatter('area', 'poptotal', data=midwest.loc[midwest.category==category, :], s=20, cmap=colors[i], label=str(category))

# Decorations
plt.gca().set(xlim=(0.0, 0.1), ylim=(0, 90000),xlabel='Area', ylabel='Population')

plt.xticks(fontsize=12)
plt.yticks(fontsize=12)
plt.title("Scatterplot of Midwest Area vs Population", fontsize=22)
plt.legend(fontsize=12)
plt.show()
# d:\anaconda3\lib\site-packages\ipykernel\ipkernel.py:287: DeprecationWarning: `should_run_async` will not call `transform_cell` automatically in the future. Please pass the result to `transformed_cell` argument and any exception that happen during thetransform in `preprocessing_exc_tuple` in IPython 7.17 and above.
# and should_run_async(code)

np.unique():列表元素去重
当前的图表和子图可以使用plt.gcf()plt.gca()获得,分别表示”Get Current Figure”和”Get Current Axes”,这样可以方便的设置x,y轴显示范围及标签。
enumerate(sequence, [start=0])函数用于将一个可遍历的数据对象(如列表、元组或字符串)组合为一个索引序列,同时列出数据和数据下标,一般用在 for 循环当中。

带边界的气泡图(Bubble plot with Encircling)

有时,您希望在边界内显示一组点以强调其重要性。 在这个例子中,你从数据框中获取记录,并用下面代码中描述的 encircle() 来使边界显示出来。

1
2
3
4
5
6
7
8
9
10
11
12
13
14
15
16
17
18
19
20
21
22
23
24
25
26
27
28
29
30
31
32
33
34
35
36
37
38
39
40
41
42
43
from matplotlib import patches
from scipy.spatial import ConvexHull
import warnings; warnings.simplefilter('ignore')
sns.set_style("white")

# Step 1: Prepare Data
midwest = pd.read_csv("midwest_filter.csv")

# As many colors as there are unique midwest['category']
categories = np.unique(midwest['category'])
colors = [plt.cm.tab10(i/float(len(categories)-1)) for i in range(len(categories))]

# Step 2: Draw Scatterplot with unique color for each category
fig = plt.figure(figsize=(16, 10), dpi= 80, facecolor='w', edgecolor='k')

for i, category in enumerate(categories):
plt.scatter('area', 'poptotal', data=midwest.loc[midwest.category==category, :],
s='dot_size', cmap=colors[i], label=str(category), edgecolors='black', linewidths=.5)

# Step 3: Encircling
# https://stackoverflow.com/questions/44575681/how-do-i-encircle-different-data-sets-in-scatter-plot
def encircle(x,y, ax=None, **kw):
if not ax: ax=plt.gca()
p = np.c_[x,y]
hull = ConvexHull(p)
poly = plt.Polygon(p[hull.vertices,:], **kw)
ax.add_patch(poly)

# Select data to be encircled
midwest_encircle_data = midwest.loc[midwest.state=='IN', :]

# Draw polygon surrounding vertices
encircle(midwest_encircle_data.area, midwest_encircle_data.poptotal, ec="k", fc="gold", alpha=0.1)
encircle(midwest_encircle_data.area, midwest_encircle_data.poptotal, ec="firebrick", fc="none", linewidth=1.5)

# Step 4: Decorations
plt.gca().set(xlim=(0.0, 0.1), ylim=(0, 90000),xlabel='Area', ylabel='Population')

plt.xticks(fontsize=12)
plt.yticks(fontsize=12)
plt.title("Bubble Plot with Encircling", fontsize=22)
plt.legend(fontsize=12)
plt.show()

np.r_是按列连接两个矩阵,就是把两矩阵上下相加,要求列数相等,类似于pandas中的concat()。
np.c_是按行连接两个矩阵,就是把两矩阵左右相加,要求行数相等,类似于pandas中的merge()。
ConvexHull:给定二维平面上的点集,凸包就是将最外层的点连接起来构成的凸多边型,它能包含点集中所有的点。

带线性回归最佳拟合线的散点图 (Scatter plot with linear regression line of best fit)

如果你想了解两个变量如何相互改变,那么最佳拟合线就是常用的方法。 下图显示了数据中各组之间最佳拟合线的差异。要禁用分组并仅为整个数据集绘制一条最佳拟合线,请从下面的sns.lmplot()调用中删除hue ='cyl'参数。

1
2
3
4
5
6
7
8
9
10
11
12
13
14
# Import Data
df = pd.read_csv("mpg_ggplot2.csv")
df_select = df.loc[df.cyl.isin([4,8]), :]

# Plot
sns.set_style("white")
gridobj = sns.lmplot(x="displ", y="hwy", hue="cyl", data=df_select,
aspect=1.6, robust=True, palette='tab10',
scatter_kws=dict(s=60, linewidths=.7, edgecolors='black'))

# Decorations
gridobj.set(xlim=(0.5, 7.5), ylim=(0, 50))
plt.title("Scatterplot with line of best fit grouped by number of cylinders", fontsize=20)
plt.show()

如果报错No module named 'statsmodels',执行:

1
pip install statsmodels

针对每列绘制线性回归线

或者,可以在其每列中显示每个组的最佳拟合线。 可以通过在sns.lmplot()中设置col=groupingcolumn参数来实现,如下:

1
2
3
4
5
6
7
8
9
10
11
12
13
14
15
16
# Import Data
df = pd.read_csv("mpg_ggplot2.csv")
df_select = df.loc[df.cyl.isin([4,8]), :]

# Each line in its own column
sns.set_style("white")
gridobj = sns.lmplot(x="displ", y="hwy",
data=df_select,
robust=True,
palette='Set1',
col="cyl",
scatter_kws=dict(s=60, linewidths=.7, edgecolors='black'))

# Decorations
gridobj.set(xlim=(0.5, 7.5), ylim=(0, 50))
plt.show()

边缘直方图 (Marginal Histogram)

边缘直方图具有沿 X 和 Y 轴变量的直方图。 这用于可视化 X 和 Y 之间的关系以及单独的 X 和 Y 的单变量分布。 这种图经常用于探索性数据分析(EDA)。

1
2
3
4
5
6
7
8
9
10
11
12
13
14
15
16
17
18
19
20
21
22
23
24
25
26
27
28
29
30
31
# Import Data
df = pd.read_csv("mpg_ggplot2.csv")

# Create Fig and gridspec
fig = plt.figure(figsize=(16, 10), dpi= 80)
grid = plt.GridSpec(4, 4, hspace=0.5, wspace=0.2)

# Define the axes
ax_main = fig.add_subplot(grid[:-1, :-1])
ax_right = fig.add_subplot(grid[:-1, -1], xticklabels=[], yticklabels=[])
ax_bottom = fig.add_subplot(grid[-1, 0:-1], xticklabels=[], yticklabels=[])

# Scatterplot on main ax
ax_main.scatter('displ', 'hwy', s=df.cty*4, c=df.manufacturer.astype('category').cat.codes, alpha=.9, data=df, cmap="tab10", edgecolors='gray', linewidths=.5)

# histogram on the right
ax_bottom.hist(df.displ, 40, histtype='stepfilled', orientation='vertical', color='deeppink')
ax_bottom.invert_yaxis()

# histogram in the bottom
ax_right.hist(df.hwy, 40, histtype='stepfilled', orientation='horizontal', color='deeppink')

# Decorations
ax_main.set(title='Scatterplot with Histograms \n displ vs hwy', xlabel='displ', ylabel='hwy')
ax_main.title.set_fontsize(20)
for item in ([ax_main.xaxis.label, ax_main.yaxis.label] + ax_main.get_xticklabels() + ax_main.get_yticklabels()):
item.set_fontsize(14)

xlabels = ax_main.get_xticks().tolist()
ax_main.set_xticklabels(xlabels)
plt.show()

边缘箱形图 (Marginal Boxplot)

边缘箱图与边缘直方图具有相似的用途。 然而,箱线图有助于精确定位 X 和 Y 的中位数、第25和第75百分位数。

1
2
3
4
5
6
7
8
9
10
11
12
13
14
15
16
17
18
19
20
21
22
23
24
25
26
27
28
29
30
31
32
33
# Import Data
df = pd.read_csv("mpg_ggplot2.csv")

# Create Fig and gridspec
fig = plt.figure(figsize=(16, 10), dpi= 80)
grid = plt.GridSpec(4, 4, hspace=0.5, wspace=0.2)

# Define the axes
ax_main = fig.add_subplot(grid[:-1, :-1])
ax_right = fig.add_subplot(grid[:-1, -1], xticklabels=[], yticklabels=[])
ax_bottom = fig.add_subplot(grid[-1, 0:-1], xticklabels=[], yticklabels=[])

# Scatterplot on main ax
ax_main.scatter('displ', 'hwy', s=df.cty*5, c=df.manufacturer.astype('category').cat.codes, alpha=.9, data=df, cmap="Set1", edgecolors='black', linewidths=.5)

# Add a graph in each part
sns.boxplot(df.hwy, ax=ax_right, orient="v")
sns.boxplot(df.displ, ax=ax_bottom, orient="h")

# Decorations ------------------
# Remove x axis name for the boxplot
ax_bottom.set(xlabel='')
ax_right.set(ylabel='')

# Main Title, Xlabel and YLabel
ax_main.set(title='Scatterplot with Histograms \n displ vs hwy', xlabel='displ', ylabel='hwy')

# Set font size of different components
ax_main.title.set_fontsize(20)
for item in ([ax_main.xaxis.label, ax_main.yaxis.label] + ax_main.get_xticklabels() + ax_main.get_yticklabels()):
item.set_fontsize(14)

plt.show()

相关图 (Correllogram)

相关图用于直观地查看给定数据框(或二维数组)中所有可能的数值变量对之间的相关度量。

1
2
3
4
5
6
7
8
9
10
11
12
# Import Dataset
df = pd.read_csv("mtcars.csv")

# Plot
plt.figure(figsize=(12,10), dpi= 80)
sns.heatmap(df.corr(), xticklabels=df.corr().columns, yticklabels=df.corr().columns, cmap='RdYlGn', center=0, annot=True)

# Decorations
plt.title('Correlogram of mtcars', fontsize=22)
plt.xticks(fontsize=12)
plt.yticks(fontsize=12)
plt.show()

矩阵图 (Pairwise Plot)

矩阵图是探索性分析中的最爱,用于理解所有可能的数值变量对之间的关系。 它是双变量分析的必备工具。

1
2
3
4
5
6
7
8
# Load Dataset
df = sns.load_dataset('iris')

# Plot
plt.figure(figsize=(10,8), dpi= 80)
sns.pairplot(df, kind="scatter", hue="species", plot_kws=dict(s=80, edgecolor="white", linewidth=2.5))
plt.show()
# <Figure size 800x640 with 0 Axes>
1
2
3
4
5
6
7
8
# Load Dataset
df = sns.load_dataset('iris')

# Plot
plt.figure(figsize=(10,8), dpi= 80)
sns.pairplot(df, kind="reg", hue="species")
plt.show()
# <Figure size 800x640 with 0 Axes>

偏差 (Deviation)

发散型条形图 (Diverging Bars)

如果您想根据单个指标查看项目的变化情况,并可视化此差异的顺序和数量,那么散型条形图 (Diverging Bars) 是一个很好的工具。 它有助于快速区分数据中组的性能,并且非常直观,并且可以立即传达这一点。

1
2
3
4
5
6
7
8
9
10
11
12
13
14
15
16
17
18
# Prepare Data
df = pd.read_csv("mtcars.csv")
x = df.loc[:, ['mpg']]
df['mpg_z'] = (x - x.mean())/x.std()
df['colors'] = ['red' if x < 0 else 'green' for x in df['mpg_z']]
df.sort_values('mpg_z', inplace=True)
df.reset_index(inplace=True)

# Draw plot
plt.figure(figsize=(14,10), dpi= 80)
plt.hlines(y=df.index, xmin=0, xmax=df.mpg_z, color=df.colors, alpha=0.4, linewidth=5)

# Decorations
plt.gca().set(ylabel='$Model$', xlabel='$Mileage$')
plt.yticks(df.index, df.cars, fontsize=12)
plt.title('Diverging Bars of Car Mileage', fontdict={'size':20})
plt.grid(linestyle='--', alpha=0.5)
plt.show()

发散型文本 (Diverging Texts)

发散型文本 (Diverging Texts)与发散型条形图 (Diverging Bars)相似,如果你想以一种漂亮和可呈现的方式显示图表中每个项目的价值,就可以使用这种方法。

1
2
3
4
5
6
7
8
9
10
11
12
13
14
15
16
17
18
19
20
21
# Prepare Data
df = pd.read_csv("mtcars.csv")
x = df.loc[:, ['mpg']]
df['mpg_z'] = (x - x.mean())/x.std()
df['colors'] = ['red' if x < 0 else 'green' for x in df['mpg_z']]
df.sort_values('mpg_z', inplace=True)
df.reset_index(inplace=True)

# Draw plot
plt.figure(figsize=(14,14), dpi= 80)
plt.hlines(y=df.index, xmin=0, xmax=df.mpg_z)
for x, y, tex in zip(df.mpg_z, df.index, df.mpg_z):
t = plt.text(x, y, round(tex, 2), horizontalalignment='right' if x < 0 else 'left',
verticalalignment='center', fontdict={'color':'red' if x < 0 else 'green', 'size':14})

# Decorations
plt.yticks(df.index, df.cars, fontsize=12)
plt.title('Diverging Text Bars of Car Mileage', fontdict={'size':20})
plt.grid(linestyle='--', alpha=0.5)
plt.xlim(-2.5, 2.5)
plt.show()

发散型包点图 (Diverging Dot Plot)

发散型包点图 (Diverging Dot Plot)也类似于发散型条形图 (Diverging Bars)。 然而,与发散型条形图 (Diverging Bars)相比,条的缺失减少了组之间的对比度和差异。

1
2
3
4
5
6
7
8
9
10
11
12
13
14
15
16
17
18
19
20
21
22
23
24
25
26
27
28
# Prepare Data
df = pd.read_csv("mtcars.csv")
x = df.loc[:, ['mpg']]
df['mpg_z'] = (x - x.mean())/x.std()
df['colors'] = ['red' if x < 0 else 'darkgreen' for x in df['mpg_z']]
df.sort_values('mpg_z', inplace=True)
df.reset_index(inplace=True)

# Draw plot
plt.figure(figsize=(14,16), dpi= 80)
plt.scatter(df.mpg_z, df.index, s=450, alpha=.6, color=df.colors)
for x, y, tex in zip(df.mpg_z, df.index, df.mpg_z):
t = plt.text(x, y, round(tex, 1), horizontalalignment='center',
verticalalignment='center', fontdict={'color':'white'})

# Decorations
# Lighten borders
plt.gca().spines["top"].set_alpha(.3)
plt.gca().spines["bottom"].set_alpha(.3)
plt.gca().spines["right"].set_alpha(.3)
plt.gca().spines["left"].set_alpha(.3)

plt.yticks(df.index, df.cars)
plt.title('Diverging Dotplot of Car Mileage', fontdict={'size':20})
plt.xlabel('$Mileage$')
plt.grid(linestyle='--', alpha=0.5)
plt.xlim(-2.5, 2.5)
plt.show()

带标记的发散型棒棒糖图 (Diverging Lollipop Chart with Markers)

带标记的棒棒糖图通过强调您想要引起注意的任何重要数据点并在图表中适当地给出推理,提供了一种对差异进行可视化的灵活方式。

1
2
3
4
5
6
7
8
9
10
11
12
13
14
15
16
17
18
19
20
21
22
23
24
25
26
27
28
29
30
31
32
33
34
35
36
37
# Prepare Data
df = pd.read_csv("mtcars.csv")
x = df.loc[:, ['mpg']]
df['mpg_z'] = (x - x.mean())/x.std()
df['colors'] = 'black'

# color fiat differently
df.loc[df.cars == 'Fiat X1-9', 'colors'] = 'darkorange'
df.sort_values('mpg_z', inplace=True)
df.reset_index(inplace=True)


# Draw plot
import matplotlib.patches as patches

plt.figure(figsize=(14,16), dpi= 80)
plt.hlines(y=df.index, xmin=0, xmax=df.mpg_z, color=df.colors, alpha=0.4, linewidth=1)
plt.scatter(df.mpg_z, df.index, color=df.colors, s=[600 if x == 'Fiat X1-9' else 300 for x in df.cars], alpha=0.6)
plt.yticks(df.index, df.cars)
plt.xticks(fontsize=12)

# Annotate
plt.annotate('Mercedes Models', xy=(0.0, 11.0), xytext=(1.0, 11), xycoords='data',
fontsize=15, ha='center', va='center',
bbox=dict(boxstyle='square', fc='firebrick'),
arrowprops=dict(arrowstyle='-[, widthB=2.0, lengthB=1.5', lw=2.0, color='steelblue'), color='white')

# Add Patches
p1 = patches.Rectangle((-2.0, -1), width=.3, height=3, alpha=.2, facecolor='red')
p2 = patches.Rectangle((1.5, 27), width=.8, height=5, alpha=.2, facecolor='green')
plt.gca().add_patch(p1)
plt.gca().add_patch(p2)

# Decorate
plt.title('Diverging Bars of Car Mileage', fontdict={'size':20})
plt.grid(linestyle='--', alpha=0.5)
plt.show()

面积图 (Area Chart)

通过对轴和线之间的区域进行着色,面积图不仅强调峰和谷,而且还强调高点和低点的持续时间。 高点持续时间越长,线下面积越大。
这里annotate的函数值得学习,台风路径信息的框框或者文字避让算法,都需要用到这个函数。

1
2
3
4
5
6
7
8
9
10
11
12
13
14
15
16
17
18
19
20
21
22
23
24
25
26
27
28
29
import numpy as np
import pandas as pd

# Prepare Data
df = pd.read_csv("economics.csv", parse_dates=['date']).head(100)
x = np.arange(df.shape[0])
y_returns = (df.psavert.diff().fillna(0)/df.psavert.shift(1)).fillna(0) * 100

# Plot
plt.figure(figsize=(16,10), dpi= 80)
plt.fill_between(x[1:], y_returns[1:], 0, where=y_returns[1:] >= 0, facecolor='green', interpolate=True, alpha=0.7)
plt.fill_between(x[1:], y_returns[1:], 0, where=y_returns[1:] <= 0, facecolor='red', interpolate=True, alpha=0.7)

# Annotate
plt.annotate('Peak \n1975', xy=(94.0, 21.0), xytext=(88.0, 28),
bbox=dict(boxstyle='square', fc='firebrick'),
arrowprops=dict(facecolor='steelblue', shrink=0.05), fontsize=15, color='white')


# Decorations
xtickvals = [str(m)[:3].upper()+"-"+str(y) for y,m in zip(df.date.dt.year, df.date.dt.month_name())]
plt.gca().set_xticks(x[::6])
plt.gca().set_xticklabels(xtickvals[::6], rotation=90, fontdict={'horizontalalignment': 'center', 'verticalalignment': 'center_baseline'})
plt.ylim(-35,35)
plt.xlim(1,100)
plt.title("Month Economics Return %", fontsize=22)
plt.ylabel('Monthly returns %')
plt.grid(alpha=0.5)
plt.show()

排序 (Ranking)

有序条形图 (Ordered Bar Chart)

有序条形图有效地传达了项目的排名顺序。 但是,在图表上方添加度量标准的值,用户可以从图表本身获取精确信息。

1
2
3
4
5
6
7
8
9
10
11
12
13
14
15
16
17
18
19
20
21
22
23
24
25
26
27
28
# Prepare Data
df_raw = pd.read_csv("mpg_ggplot2.csv")
df = df_raw[['cty', 'manufacturer']].groupby('manufacturer').apply(lambda x: x.mean())
df.sort_values('cty', inplace=True)
df.reset_index(inplace=True)

# Draw plot
import matplotlib.patches as patches

fig, ax = plt.subplots(figsize=(16,10), facecolor='white', dpi= 80)
ax.vlines(x=df.index, ymin=0, ymax=df.cty, color='firebrick', alpha=0.7, linewidth=20)

# Annotate Text
for i, cty in enumerate(df.cty):
ax.text(i, cty+0.5, round(cty, 1), horizontalalignment='center')


# Title, Label, Ticks and Ylim
ax.set_title('Bar Chart for Highway Mileage', fontdict={'size':22})
ax.set(ylabel='Miles Per Gallon', ylim=(0, 30))
plt.xticks(df.index, df.manufacturer.str.upper(), rotation=60, horizontalalignment='right', fontsize=12)

# Add patches to color the X axis labels
p1 = patches.Rectangle((.57, -0.005), width=.33, height=.13, alpha=.1, facecolor='green', transform=fig.transFigure)
p2 = patches.Rectangle((.124, -0.005), width=.446, height=.13, alpha=.1, facecolor='red', transform=fig.transFigure)
fig.add_artist(p1)
fig.add_artist(p2)
plt.show()

棒棒糖图 (Lollipop Chart)

棒棒糖图表以一种视觉上令人愉悦的方式提供与有序条形图类似的目的。

1
2
3
4
5
6
7
8
9
10
11
12
13
14
15
16
17
18
19
20
21
22
23
# Prepare Data
df_raw = pd.read_csv("mpg_ggplot2.csv")
df = df_raw[['cty', 'manufacturer']].groupby('manufacturer').apply(lambda x: x.mean())
df.sort_values('cty', inplace=True)
df.reset_index(inplace=True)

# Draw plot
fig, ax = plt.subplots(figsize=(16,10), dpi= 80)
ax.vlines(x=df.index, ymin=0, ymax=df.cty, color='firebrick', alpha=0.7, linewidth=2)
ax.scatter(x=df.index, y=df.cty, s=75, color='firebrick', alpha=0.7)

# Title, Label, Ticks and Ylim
ax.set_title('Lollipop Chart for Highway Mileage', fontdict={'size':22})
ax.set_ylabel('Miles Per Gallon')
ax.set_xticks(df.index)
ax.set_xticklabels(df.manufacturer.str.upper(), rotation=60, fontdict={'horizontalalignment': 'right', 'size':12})
ax.set_ylim(0, 30)

# Annotate
for row in df.itertuples():
ax.text(row.Index, row.cty+.5, s=round(row.cty, 2), horizontalalignment= 'center', verticalalignment='bottom', fontsize=14)

plt.show()

包点图 (Dot Plot)

包点图表传达了项目的排名顺序,并且由于它沿水平轴对齐,因此您可以更容易地看到点彼此之间的距离。

1
2
3
4
5
6
7
8
9
10
11
12
13
14
15
16
17
18
# Prepare Data
df_raw = pd.read_csv("mpg_ggplot2.csv")
df = df_raw[['cty', 'manufacturer']].groupby('manufacturer').apply(lambda x: x.mean())
df.sort_values('cty', inplace=True)
df.reset_index(inplace=True)

# Draw plot
fig, ax = plt.subplots(figsize=(16,10), dpi= 80)
ax.hlines(y=df.index, xmin=11, xmax=26, color='gray', alpha=0.7, linewidth=1, linestyles='dashdot')
ax.scatter(y=df.index, x=df.cty, s=75, color='firebrick', alpha=0.7)

# Title, Label, Ticks and Ylim
ax.set_title('Dot Plot for Highway Mileage', fontdict={'size':22})
ax.set_xlabel('Miles Per Gallon')
ax.set_yticks(df.index)
ax.set_yticklabels(df.manufacturer.str.title(), fontdict={'horizontalalignment': 'right'})
ax.set_xlim(10, 27)
plt.show()

坡度图 (Slope Chart)

坡度图最适合比较给定人/项目的“前”和“后”位置。

1
2
3
4
5
6
7
8
9
10
11
12
13
14
15
16
17
18
19
20
21
22
23
24
25
26
27
28
29
30
31
32
33
34
35
36
37
38
39
40
41
42
43
44
45
46
47
48
49
import matplotlib.lines as mlines
# Import Data
df = pd.read_csv("gdppercap.csv")

left_label = [str(c) + ', '+ str(round(y)) for c, y in zip(df.continent, df['1952'])]
right_label = [str(c) + ', '+ str(round(y)) for c, y in zip(df.continent, df['1957'])]
klass = ['red' if (y1-y2) < 0 else 'green' for y1, y2 in zip(df['1952'], df['1957'])]

# draw line
# https://stackoverflow.com/questions/36470343/how-to-draw-a-line-with-matplotlib/36479941
def newline(p1, p2, color='black'):
ax = plt.gca()
l = mlines.Line2D([p1[0],p2[0]], [p1[1],p2[1]], color='red' if p1[1]-p2[1] > 0 else 'green', marker='o', markersize=6)
ax.add_line(l)
return l

fig, ax = plt.subplots(1,1,figsize=(14,14), dpi= 80)

# Vertical Lines
ax.vlines(x=1, ymin=500, ymax=13000, color='black', alpha=0.7, linewidth=1, linestyles='dotted')
ax.vlines(x=3, ymin=500, ymax=13000, color='black', alpha=0.7, linewidth=1, linestyles='dotted')

# Points
ax.scatter(y=df['1952'], x=np.repeat(1, df.shape[0]), s=10, color='black', alpha=0.7)
ax.scatter(y=df['1957'], x=np.repeat(3, df.shape[0]), s=10, color='black', alpha=0.7)

# Line Segmentsand Annotation
for p1, p2, c in zip(df['1952'], df['1957'], df['continent']):
newline([1,p1], [3,p2])
ax.text(1-0.05, p1, c + ', ' + str(round(p1)), horizontalalignment='right', verticalalignment='center', fontdict={'size':14})
ax.text(3+0.05, p2, c + ', ' + str(round(p2)), horizontalalignment='left', verticalalignment='center', fontdict={'size':14})

# 'Before' and 'After' Annotations
ax.text(1-0.05, 13000, 'BEFORE', horizontalalignment='right', verticalalignment='center', fontdict={'size':18, 'weight':700})
ax.text(3+0.05, 13000, 'AFTER', horizontalalignment='left', verticalalignment='center', fontdict={'size':18, 'weight':700})

# Decoration
ax.set_title("Slopechart: Comparing GDP Per Capita between 1952 vs 1957", fontdict={'size':22})
ax.set(xlim=(0,4), ylim=(0,14000), ylabel='Mean GDP Per Capita')
ax.set_xticks([1,3])
ax.set_xticklabels(["1952", "1957"])
plt.yticks(np.arange(500, 13000, 2000), fontsize=12)

# Lighten borders
plt.gca().spines["top"].set_alpha(.0)
plt.gca().spines["bottom"].set_alpha(.0)
plt.gca().spines["right"].set_alpha(.0)
plt.gca().spines["left"].set_alpha(.0)
plt.show()

哑铃图 (Dumbbell Plot)

哑铃图表传达了各种项目的“前”和“后”位置以及项目的等级排序。 如果您想要将特定项目/计划对不同对象的影响可视化,那么它非常有用。

1
2
3
4
5
6
7
8
9
10
11
12
13
14
15
16
17
18
19
20
21
22
23
24
25
26
27
28
29
30
31
32
33
34
35
36
37
38
39
import matplotlib.lines as mlines

# Import Data
df = pd.read_csv("health.csv")
df.sort_values('pct_2014', inplace=True)
df.reset_index(inplace=True)

# Func to draw line segment
def newline(p1, p2, color='black'):
ax = plt.gca()
l = mlines.Line2D([p1[0],p2[0]], [p1[1],p2[1]], color='skyblue')
ax.add_line(l)
return l

# Figure and Axes
fig, ax = plt.subplots(1,1,figsize=(14,14), facecolor='#f7f7f7', dpi= 80)

# Vertical Lines
ax.vlines(x=.05, ymin=0, ymax=26, color='black', alpha=1, linewidth=1, linestyles='dotted')
ax.vlines(x=.10, ymin=0, ymax=26, color='black', alpha=1, linewidth=1, linestyles='dotted')
ax.vlines(x=.15, ymin=0, ymax=26, color='black', alpha=1, linewidth=1, linestyles='dotted')
ax.vlines(x=.20, ymin=0, ymax=26, color='black', alpha=1, linewidth=1, linestyles='dotted')

# Points
ax.scatter(y=df['index'], x=df['pct_2013'], s=50, color='#0e668b', alpha=0.7)
ax.scatter(y=df['index'], x=df['pct_2014'], s=50, color='#a3c4dc', alpha=0.7)

# Line Segments
for i, p1, p2 in zip(df['index'], df['pct_2013'], df['pct_2014']):
newline([p1, i], [p2, i])

# Decoration
ax.set_facecolor('#f7f7f7')
ax.set_title("Dumbell Chart: Pct Change - 2013 vs 2014", fontdict={'size':22})
ax.set(xlim=(0,.25), ylim=(-1, 27), ylabel='Mean GDP Per Capita')
ax.set_xticks([.05, .1, .15, .20])
ax.set_xticklabels(['5%', '15%', '20%', '25%'])
plt.show()