期刊投稿的准备工作及注意事项

本文以一次 Acta Materialia 返修经历为例,整理英文学术期刊投稿时常见的材料、模板与注意事项,包括 manuscript、cover letter、suggested reviewers、graphical abstract、highlights、declaration of interests 和 response letter。
2026 年更新: 下文中的审稿回复属于特定稿件的历史记录,不能替代目标期刊当前的 Guide for Authors。各期刊对图形摘要、Highlights、利益冲突与生成式 AI 声明的要求会变化,投稿前应重新核对官方页面。
Cover letter
Cover letter是投稿时与Manuscript一同发送给Editor的投稿信件,用几句话简明扼要的交代给Editor本文的内容梗概或对于这次修改的反馈。一封内容简洁明了的Cover Letter会让Editor对论文的第一印象加分不少。在信中需简要列出文章的创新点,并且说明全部作者同意投稿,宣称没有利益冲突,该文章没有在其他期刊发表过等责任声明信息。注意期刊名斜体。在此列出本篇文章首次投稿与第三次返稿时的Cover Letter实例:
Dear Editor,
We would like to submit the above manuscript for your consideration of its publication in Acta Materialia. The work described has not been submitted elsewhere for publication, in whole or in part, and all the authors listed have approved the manuscript that is enclosed.
We believe this manuscript will interest the broad readership of Acta Materialia because of its novelty, significance, and subject matter. Studies of nuclear materials recovered from decommissioned reactors can improve our understanding of radiation damage and reactor aging, but such studies remain scarce because these materials are difficult to access. Using synchrotron tomography, we present an in situ, three-dimensional characterization of the deformation dynamics of an LT21 Al alloy after 30 years of service in a nuclear environment under quasi-static uniaxial tension. We propose a particle-tracking method to quantify the displacement and strain fields and the microstructural evolution of the irradiated sample. The resulting multiscale data can support physics-based model development and the design of nuclear structures.
We are looking forward to your positive response. Thank you!
第三次返稿时Cover Letter:
Dear Prof. Wang,
We thank the editor for the opportunity to revise our manuscript and the reviewers for their constructive comments. We have revised the manuscript accordingly.
We would like to submit the revised manuscript for your consideration of its publication in Acta Materialia. The work described has not been submitted elsewhere for publication, in whole or in part, and all the authors listed have approved the manuscript that is enclosed.
We are looking forward to your response.
Suggested Reviewers
推荐审稿人应优先考虑与稿件核心问题直接相关、能够独立评价工作的研究者,并遵守期刊关于利益冲突、近期合作、同机构关系和导师—学生关系的限制。候选人可以从相关高质量论文的通讯作者中寻找,但不应只按声望选择。推荐理由应说明其专业领域、代表性工作以及与本稿的具体关联。以下示例仅展示写法,实际投稿前还需逐一核查利益冲突。
Prof. Li is an expert in solid mechanics. Using micro computed tomography (CT) and CT-based numerical modelling, he and his group have done excellent work on the structure—property relations of various engineering materials, especially on foams. He is surely suitable and capable of reviewing this manuscript.
Prof. Hutchinson is an expert in materials science. He and his group have done cutting-edge work on the property and deformation mechanisms of Al alloys, especially on precipitate hardening. He is surely suitable and capable of reviewing this manuscript.
Prof. Wang is an expert in nuclear engineering and materials science. He and his group have done excellent work on radiation-induced microstructural evolution and damage of various metal materials. His expertise is directly related to this manuscript. He is surely suitable and capable of reviewing this manuscript.
Prof. Aydogan is an expert in nuclear engineering. She has done excellent work on radiation effects on microstructures and mechanical properties of various metal materials. Her expertise is directly related to this manuscript. She is surely suitable and capable of reviewing this manuscript.
Graphical Abstract
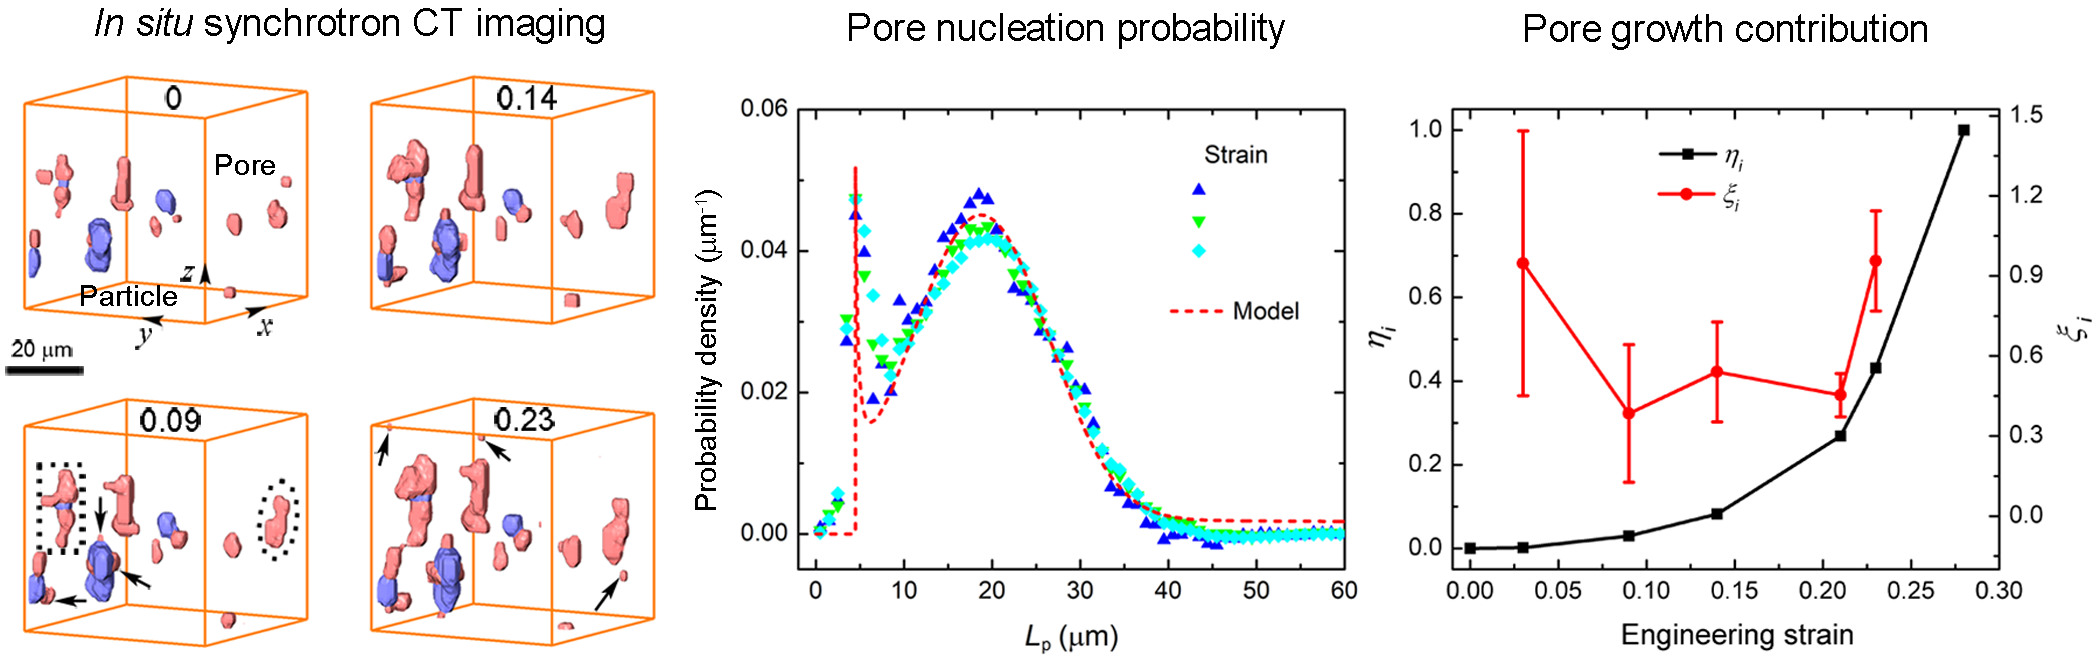
Graphical abstract 应在一幅图中概括研究问题、方法和核心结论,并尽量做到脱离正文也能理解。Elsevier 的通用建议目前给出至少 1328 × 531 像素、约 5:2 的宽高关系,但具体期刊可能另有文件格式和尺寸要求,仍应以目标期刊的 Guide for Authors 为准。参见 Elsevier graphical abstract 指南。
Highlights
Highlights 用极简短的条目概括论文最重要的发现。是否需要提交、条目数量和字数限制均可能因期刊及投稿系统更新而变化;不要沿用“某期刊已经不需要”的旧结论,投稿时应直接查看目标期刊的最新要求。以下以 H. Y. Li 等发表于 Powder Technology(2020)的写法为例:
- First in situ characterization of particle breakage in carbonate sands
- Particle shape and intra-granular porosity affects breakage strength
- Fractal dimension of crack networks increases with particle breakage extent
- Cleavage along initial pores leads to crack branching
Response Letter
在期刊投稿中,首次录用的比例相对较小,大部分的文章都会进行小修或大修。无论是小修或大修,都需要按照审稿人意见逐条认真修改并回复。若审稿人问题存在误解或错误,也可进行客观平和的解释澄清。文章审稿意见回复是除Manuscript外最重要的信息,回复与修改质量直接关系到文章接受与否。一般情况下,审稿人的问题会出现几种情况:
- 文章格式/文字/图表标记错误
Response: We are very sorry for our incorrect writing and it is rectified at Line …. or We are very sorry for our negligence of the explanation.
- 不太同意审稿人的观点,轻度argue(合理修改和把握Argue分寸,即使你要argue也最好罗列一些你的进一步证据,或别的大牛的经典文章)
Response: We agree with you that…., however, …… or As Reviewer suggested that It is important to … However.
- 需要补充实验
Response: 做这个实验。对审稿人的意见表示赞同(We agree that more study or more data would be useful to)。如果实验结果能说明问题,则要把结果补充到论文中。反之,要展示、分析数据,告知审稿人已做此实验,但没有得到有价值的结果,并阐明原因。
没有实验条件,或者不能在短时期内做此实验怎么办?可以向审稿人表示后期如果条件成熟了,可能会进行审稿人说的相关研究,这部分可以写到discussion部分下的subchapter下的future improvement部分。
- 论文创新性不强(对于这类关于创新不足的意见,一定要好好回复。一旦不被认可的话就会评判为文章没创新点,一个没有创新的文章,很难被录用。)
Response:谢谢您的意见。我们这篇论文原稿的引言部分没有把新意、重要性写清楚;鉴于此,我们已经加强了引言部分,把创新性强调出来。本文的创新性就在于……。首先还是要肯定审稿人说的对,他提出的方法或者已经存在的方法也很好,但本文的核心创新点在于和已经存在的方法不一样。适当的情况下可以比较下优缺点,加一些这方面的总结(觉得自己归纳的不好就别加了,以防弄巧成拙)。
- 这句话有歧义。审稿人是读者的代表,既然他们会产生误解,那么其他读者也会有误解。因此,可以把涉及的句子重新变换一下,写得清楚一些。
Response:谢谢提醒。我们原本的写作的确会引起歧义,现在我们根据审稿人的意见修改如下……
在此列出第一次修改时的Response Letter实例:
Response to reviewer’s comments: “Deformation dynamics of a neutron-irradiated aluminum alloy: an in situ synchrotron tomography study” by H. W. Chai, D. Fan, J. C. Yuan, L. Hu, H. L. Xie, G. H. Du, Q. J. Feng, W. Zhou, J. Y. Huang, Ms. Ref. A-21-2294.
We appreciate the constructive remarks by the referee and have revised the manuscript accordingly. The comments raised are all addressed as follows. The revision details are marked in red (reviewer #1) and in blue (reviewer #2) in the revised manuscript.
Responds to the reviewers’ comments:
Reviewer #1
Authors studied the mechanical behavior of an LT21 aluminum alloy form a decommissioned research reactor with in situ synchrotron micro-tomography. They developed particle tracking analysis technique to quantify the geometric features of the precipitates and pores, the history of the pores’ evolution under loading, and the displacement and strain fields. The new analysis technique is very interesting and the analysis is thorough. However, the reviewer found some analysis and conclusions might be questionable. It needs further discussions before the manuscript is accepted for the publication. Below are the questions.
- Although both the pore distribution and pore nucleation probability (Fig.9) show sharper peaks in the mode I region than that in the mode II region, the integrated pore number and the probability in the mode II region are much larger than that in the mode I region. The reviewer feels the authors’ argument of “pore nucleation contributes equally or more to porosity increase in the sample during stable plastic deformation, compared to pore growth” is not convincing. This might be related to the definition of $\xi_i$ in Eq.(16).
\begin{equation}
\xi_i = \frac{(\overline\psi_i-1)V_{b,i-1}}{V_{b,i}-V_{b,i-1}},
\end{equation}
$\xi_i$ is defined as the ratio between the volumes of co-existing pores in two consecutive deformation stages. Multiplying ($\psi_i$-1) with total pore volume (including both existing and newly nucleated pores) has unclear physical meaning. In the pore analysis, all the pores in each stage were already sorted out according to their belonging regions (mode I and mode II), and pre-existing and newly nucleated pores were also cataloged. Therefore, the volume increases in mode I and mode II regions can be calculated directly. The reviewer suggests authors consider revising Eq.(16) to improve the analysis results.Response: We agree with the reviewer. The statements about irradiation-induced Si has been rewritten, see lines 204–205, page 13.
- It would be helpful to provide the ratio between the volumes of the pores in mode I and mode II regions, and the ratio between the volume growths associated to modes I and II, in each stage.
Response: Thanks for the suggestion. The ratio between the volumes of the pores in mode I and mode II regions, and the ratio between the volume growths associated to modes I and II, in each stage, are calculated and presented in Fig.8d. The total and growth volume of pores in mode I is smaller than that in mode II throughout the deformation process. However, considering that the volume of mode I pore nucleation region is much smaller than that of mode II region, the density of pores in mode I region is much larger than that in mode II region. Clarification has been made in Fig.8d, and lines 410–415, page 27.
- Please describe how the three parameters were chosen in Eq.(13).
Response: Thanks for the suggestion. Clarification has been made in lines 446-448, page 29; lines 450–453, page 30.
- In the last paragraph on page 31, it is said the flat segment in Fig.10(b) corresponds to the nucleation mode II. As seen in Fig.9(c), the population of new pores in mode II is much larger than that in mode I. In Fig.10(b), however, the population in the two ends is larger than that in the flat segment. Associating the flat segment in Fig.10(b) to mode II is controversial.
Response: Sorry for the mistake. Fig.9b has been revised to discuss the pore formation in mode I only. The pores involved are confined to the vicinity of the particles (spherical region of a radius of 9 $\mu$m). The U-shaped curves means that the pores are more prone to form at the upper and lower ends of the particles. Clarification has been made in lines 418–423, pages 27–28; lines 426–428, page 29.
- Eq.(9) needs a reference.
Response: Eq.(4) is not cited from a reference and derived as follows according to the theory of probability.
Assuming that the sample is infinitely large ($V_{\rm s}\to+\infty$) and contains only one particle, the cumulative probability that a single pore is randomly formed outside a spherical region of radius $L_{\rm b}$, $G_{\rm s}$ can be described as
\begin{equation}
G_{\rm s}(L_{\rm b}) = 1-\frac{4\pi L_{\rm b}^3}{3V_{\rm s}}.
\end{equation}
As for a multiple-particle system, considering that a single pore randomly formed outside the spherical region of radius $L_{\rm b}$ of each particle are independent events, the cumulative probability of random pore formation for all particles is calculated according to the multiplication rule, as
\begin{equation}
G_{\rm m}(L_{\rm b}) = \lim_{V_{\rm s}\to+\infty}\left(1-\frac{4\pi L_{\rm b}^3}{3V_{\rm s}}\right)^{V_{\rm s}\rho_{\rm a}},
\end{equation}
where $V_{\rm s}\rho_{\rm a}$ refers to the number of particles, and $\rho_{\rm a}$, the volume density of particles.
Then, the cumulative probability of random pore formation inside the spherical region of radius $L_{\rm b}$ of all particles is
\begin{equation}
G_{\rm II}(L_{\rm b}) = 1-G_{\rm m}(L_{\rm b}),
\end{equation}
and the probability density of pore formation via mode II is the derivation of $G_{\rm II}(L_{\rm b})$ over $L_{\rm b}$.
Clarification has been made in lines 391–404, pages 26–27.
- Fig.7 needs color legends.
Response: Sorry for the mistake. The color in Fig.6 refers to particles (blue) and pores (red), respectively. Clarification has been made in the caption of Fig.3a and b, Fig.4c and Fig.6.
- Fig.4(b) is described as volume rendering in the caption but as surface rendering in the context (last paragraph on page 18).
Response: Corrected. See lines 270, page 17.
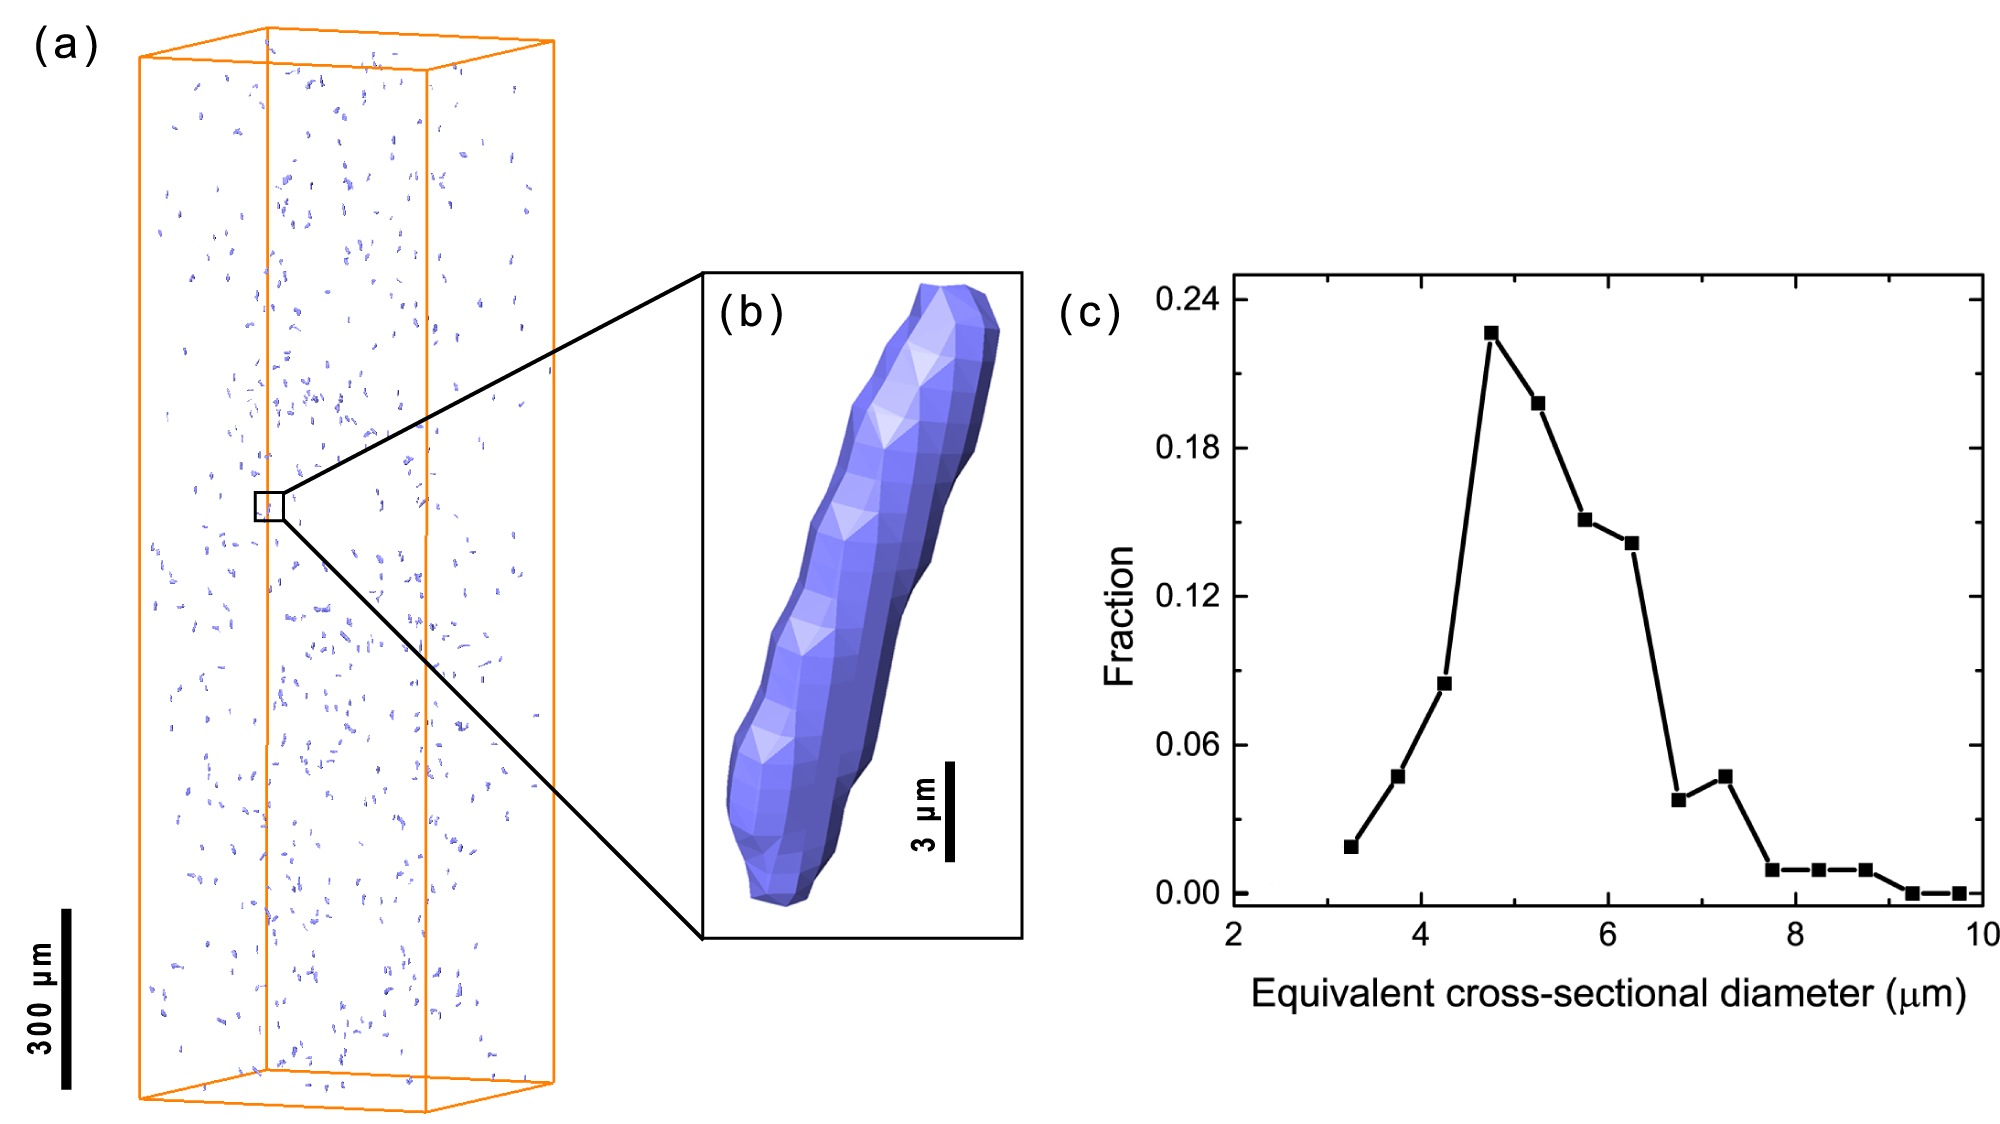
- What is the typical thickness of $\beta$-AlFeSi? Can $\beta$-AlFeSi be resolved in micro-tomography?
Response: According to the SEM and TEM images, the typical thickness of $\beta$-AlFeSi is 0.5–8 $\mu$m. Thus $\beta$-AlFeSi can be resolved by the micro-CT here. In the CT characterization, the needle-shaped Fe-based particles (elongation index less than 0.4) are taken as $\beta$-AlFeSi. The spatial distribution and equivalent cross-sectional diameter distribution of these particles are presented in Fig.R1. Clarification has been made in lines 217–218, page 14.
- It seems that there are correlations in the diameter distributions, sphericities, elongation indices, and flatness indices between pores and particles. Can authors give some discussions on the possible reasons?
Response: Good question. The corresponding statements have been deleted. Since the particles in the sample are not fully accounted (only Fe-based particles), the shape and orientation distributions for the particles are removed.
- On page 12, it is said “Both types of AlFeSi particles exist in the irradiated LT21 Al alloy.” Is this statement made based on Fig.1(a) or 1(b)?
Response: This statement is originally made based on the CT characterizations. Plate-shaped and needle-shaped particles are observed in CT images, and are taken as $\alpha$-AlFeSi and $\beta$-AlFeSi, respectively. In the revised manuscript, TEM images are supplemented to characterize the two types of AlFeSi particles (Fig.2c, g and h). Clarification has been made in lines 216–217, pages 13–14.
- The descriptions of Fig.1(a) in the figure caption and context are different.
Response: Sorry for the mistake. We remade Fig.1 and updated the corresponding description.
- In the total received dose, except of thermal neutrons and fast neutrons, what is the energy distribution of the rest portion of neutrons?
Response: The rest portion of neutrons is labeled intermediate neutrons. The dose of the intermediate neutrons is about $5.40\times10^{20}$ n/cm$^{-2}$. Clarification has been made in lines 167–171, pages 11–12.
- In X-ray imaging, the resolution is not defined as pixel size. Please revise the resolution statement on page 9.
Response: Thanks for the suggestion. The voxel size is 0.87 $\mu$m, and three-dimensional spatial resolution is quantified as about 3 $\mu$m. Clarification has been made in lines 127-128, page 9.
Based on the above concerns, the reviewer recommends major revision of the current manuscript.
Reviewer #2
This manuscript is an ambitious analysis of the microstructural features underlying the tensile deformation of an irradiated aluminum alloy. The analysis technique, CT construction of the 3D image of internal precipitates and pores using a synchrotron beam is unique for metallographic applications. The paper also employs a number of analysis techniques developed for CT constructions that classify the microstructural characteristics of the defect structures based on size and morphology. This approach adds significant statistical information about the distribution and types of the defect structures and their influence on tensile deformation.
The paper covers a number of related areas, but seems extremely lengthy for the sake of presenting the results. There are also a number of gaps in the presentation and analyses that need to be addressed. These are described individually in the following paragraphs.
- The authors do not provide either the material composition or the irradiation temperature conditions. Without this baseline information, it is not possible to interpret many of the results in the study.
Response: Thanks for the suggestion. The material composition of the unirradiated and irradiated LT21 Al alloys is provided in Table 1. The irradiation temperature conditions are provided in the revised manuscript. The target was immersed in cooling water during irradiation, and the irradiation temperature fluctuated between 20 $^\circ$C and 40 $^\circ$C. Clarification has been added to lines 171–177 and 180–183 on page 12.
- The authors do cite a number of relevant studies, but by comparison to a paper by Farrell and King (https://www.osti.gov/servlets/purl/6886356 this is only one of several similar studies by Farrell et al.), the levels of displacement damage (i.e. displacements per atom) and the conversion of Al to Si through the neutron capture reaction are very small. For the stated irradiation conditions, the level of damage should be insignificant. Since the authors provide no information on the unirradiated material or the temperature, it is not possible to determine the whether or not the microstructure is a consequence of the irradiation exposure or just a thermal aging problem. The paper cites 4.3$\times$10$^{20}$ n/cm$^2$ ($>$0.1 MeV) or 4.3$\times$10$^{24}$ n/m$^2$ ($>$0.1 MeV) might be 0.6 dpa and 0.01% (or 100 ppm) Si formation.
Response: Sorry for the misunderstanding. We supplement the EDS, EBSD, XRD and CT characterizations of the material before irradiation and the TEM characterizations on the irradiated material, as presented in Figs.1, 2 and 3. The grain size of the irradiated material is slightly larger than that of the unirradiated material (60 $\mu$m versus 50 $\mu$m). EBSD and EDS characterizations (Fig.1) show that the areal density of Si particles is higher in the irradiated material than in the unirradiated material, probably due to irradiation-induced transmutation and precipitation. In addition, the shape of AlFeSi particles are largely needle-shaped in the irradiated material, while largely plate-shaped in the unirradiated material. CT characterizations (Fig.3) show that the size of pores and particles in the irradiated material becomes larger than that in the unirradiated material. The shape of pores deviates further away from spheres and becomes more anisotropic. The orientations of pores become more aligned in the irradiated material. TEM images along with EDS characterizations show that nanoscale needle-shaped Mg$_2$Si particles appear in the irradiated material. Therefore, long-term irradiation here indeed induces considerable microstructural changes in the LT21 Al alloy. Clarification has been made in lines 184–185, page 12; lines 193–200, page 13; lines 208–231, pages 13–16.
- The authors do mention the resolution of their technique at about 3 $\mu$m or 3$\times$10$^3$ nm, which is large for typical irradiation-induced pores (i.e. voids or bubbles) for low dose irradiations. Since the gas content or possible hydrogen uptake of the material is not known, it is not possible to claim that the pores are irradiation-induced. Again, a comparison with the work of Farrell, voids at the dose level reported here should be smaller than the resolution limit (~3 $\mu$m) for this technique.
Response: Sorry for the misunderstanding. We agree that irradiation is unlikely to induce formation of new pores visible to the micro CT, but irradiation induces growth of existed pores and particles in the unirradiated material as revealed by the CT characterizations (Fig.3c). Clarification has been made in lines 235–242, page 16; lines 249–263, pages 16–17.
- The analysis in Figure 1 is also questionable. Since the figures are 2D surface images, there is no way to tell the depth of grains in the third dimension. So the distance from a visible grain boundary in EBSD does not necessarily indicate the real 3D distance from grain boundaries below the surface. This would only be possible with taking several polished sections to remove layer after layer of the surface to reveal grain depths. Further, there are several grains in the figure which are smaller than 100 $\mu$m, so the characterization of distance from the boundary is falsely skewed toward the lower numbers. This probability distribution analysis should be removed.
Response: Thanks for the suggestion. The probability distribution and the corresponding statements has been removed.
- In addition, the comment about Si clusters former near the grain boundaries needs to be supported by a mechanism. The Si formed during the neutron irradiation is formed uniformly throughout the bulk material. Segregation and clustering at the grain boundaries would require a thermal process or based on radiation-enhanced diffusivity (RED) which is not analyzed here. The comments (near the bottom middle of page 13) “Al to Si particles tend to concentrate near grain boundaries and particle interfaces” is not supported by any analysis.
Response: Thanks for the suggestion. The comment about Si clusters forming near the grain boundaries has been removed. See lines 196–197, page 13.
- The information in Fig.2 is also suspicious. First, it is unlikely that both the pores and precipitates have the same morphologies and characteristics. The authors are only able to extract precipitate information for the AlFeSi particles (page 14) and only use those for analysis. The removed any useful information about the Mg2Si phase, which is a major contributor to the tensile strengthening process (again see Farrell’s papers).
Response: Thanks for the suggestion. The shape and orientation distributions for the precipitates are removed and only those for the pores are presented in Fig.7.
- In any case the information presented in Fig.2 is also constrained by the ~3 $\mu$m resolution limit of the technique, and unlikely to be irradiation-induced microstructure.
Response: Sorry for the misunderstanding. We supplement the EDS, EBSD, XRD and CT characterizations of the material before irradiation and the TEM characterizations on the irradiated material, as presented in Figs.1, 2 and 3. Such characterizations show that long-term irradiation here indeed induces considerable microstructural changes in the LT21 Al alloy. Clarification has been made in lines 184–185, page 12; lines 193–200, page 13; lines 208–231, pages 13–16.
- The analysis in Figure 2 and at the bottom of page 14 is also problematic. The technique does not distinguish grain boundaries, so there is no way to determine if the precipitate shape is associated with planar, disk or needle-like growth at the grain boundaries.
Response: We agree with the reviewer. All discussions about grain boundaries with the micro CT have been removed or corrected. Clarification has been made in lines 249–263, pages 16–17.
- The particle tracking development for analyzing the deformation characteristics is a useful inclusion.
Response: Thank you.
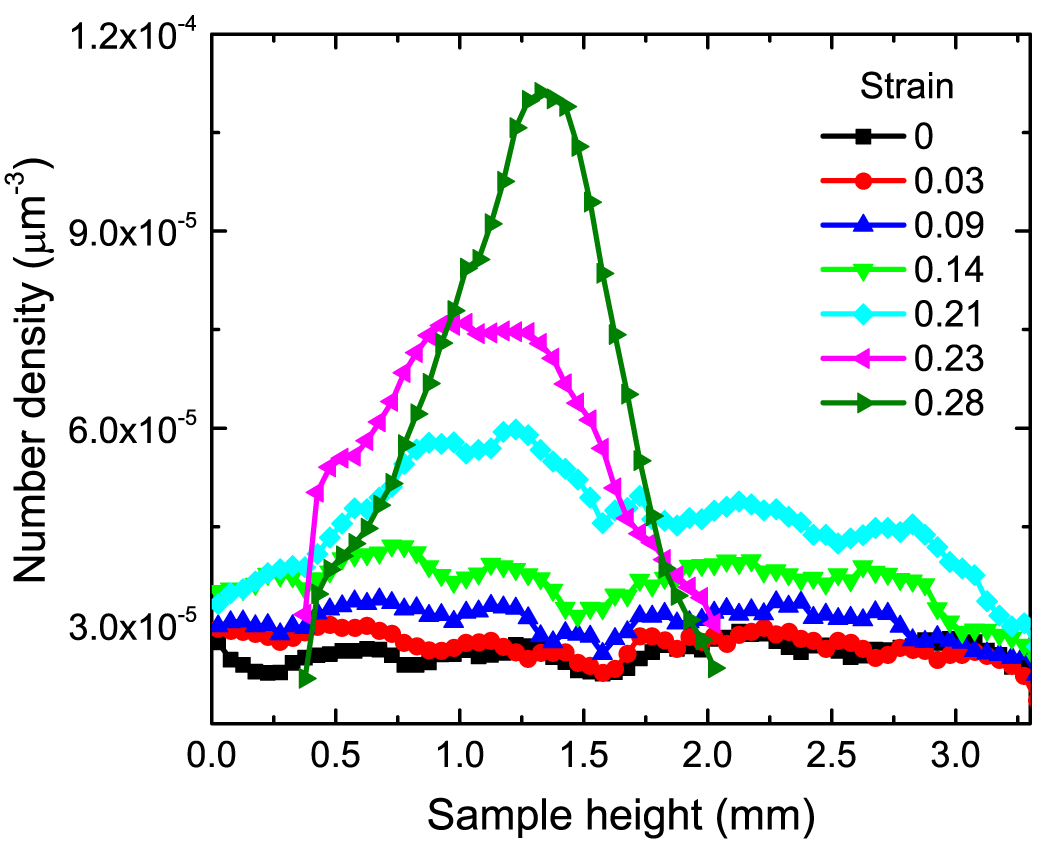
- The pore and particle tracking and growth in Fig.4 is useful. However, the authors should show pore void densities at various elevations. The figure seem to indicate that the pore growth initiates near the bottom of the selected volume between 0.09 and 0.14 strain and travels upward as the stain level increases. The authors need to explain the apparent movement of pore growth with increasing strain. This observation is also supported by the information in Figure 5 in the strain field images.
Response: Thanks for the suggestion. The pore density distribution is calculated and presented in Fig.R2, and is similar to the porosity distribution shown in Fig.7a. The movement of the pore growth region with increasing strain is attributed to the loading geometry. In the in situ CT experiment, the lower loading collet is fixed while the upper collet moves upwards to load the sample. The field of view for CT is fixed as well. The global deformation of sample thus results in an upward movement of the pore growth region. Nevertheless, the movement of the pore growth region is negligible when necking occurs in the sample. Clarification has been made in lines 131–134, page 9.
- The result of the displacement $u_z$ in Fig.5 are unclear. The authors do now sufficiently explain the meaning of these results. If they are the displacement vectors of the particles, there is no sense in showing very high particle displacement in the upper end of the specimen once necking occurs.
Response: Sorry for the misunderstanding. Strain localization, or a high displacement gradient, occurs in the necking region rather than displacement localization. In our loading geometry, the largest displacement always appears at the upper end of the sample because the upper collet moves continuously. Clarification has been added to the caption of Fig. 5(a) and to lines 280–281 on page 19.
- The sections on pore evolution and forward need to be removed. Since the resolution of the process does not account for existing microstructure below ~3 um in diameter, there is no basis for counting pore evolution or pore nucleation. The pores that seem to be ‘nucleated’ are most probably pores that are too small to resolve before the deformation process. Thus, they are not nucleated. The observations in Figure 7 of new pores are probably ones that were below the resolution limit.
Response: We agree with the reviewer that pore nucleation cannot be resolved by the micro-CT here. The corresponding statements have been revised or removed. We have stated clearly that only pores larger than 3 $\mu$m (observable) are accounted in the revised manuscript. All the discussions are made on this basis. Clarification has been made in line 303–306, page 20; lines 316–317, page 21; lines 354–356, 361, 364, 365, 372, and 374, page 24.
- Figure 6 a should be remove since there is no sense in the general pore faction once the UTS is reached. Figure 6b could be kept, but again, there should be some information about the shift in the necking region from lower in the sample to its final position. In addition, this figure should be done in absolute numbers not in ‘probablity.’ These are not probabilities (this should be changed in many other places).
Response: Thanks for the suggestion. Fig.6a has been removed. The shift of the necking region is attributed to the loading geometry, as explained in the question 10. The ‘probability’ has been replaced with ‘fraction’ in the corresponding figures and statements.
- The information in Figure 8 shows very little differences between deformed and undeformed or even as a function of strain level. There is no reason to include data for strains beyond 0.09 since 0.14 is past the UTS and the changes should be localized to the neck. The fact that there is no real change at the higher strain levels highlights this problem. The strains above 0.09 should be removed from the plot since they represent very highly localized processes and are washed out over the entire specimen length.
Response: Thanks for the suggestion. After UTS occurs in the sample, the structural information of the necking region (0.6 mm to 1.8 mm height range) is used for statistical analysis. Clarification has been made in Fig.7, and lines 335-336, page 23.
- The section on ‘Nucleation of pores’ should be removed since there is no evidence of real nucleation. The information in Fig 9 is not useful without more microstructural information below the ~3 um resolution limit. The peaks could well be due to irradiation-induced small voids which are entirely different from the ‘pores’ described in the graphs
Response: We agree with the reviewer that pore nucleation cannot be resolved by the micro-CT here. Nucleation/nucleate has been revised to formation/form or removed in the revised manuscript. Formation has been defined to include pores We have stated clearly that only pores larger than 3 $\mu$m (observable) are accounted in the revised manuscript. All the discussions are made on this basis.
- The very long section nucleation theory should be removed. It also has no basis from the resolution limit of the technique. Fitting data for nucleation in the necking region for strains greater than 0.09 also doesn’t make sense. The authors do not consider the triaxiality of the stress under the high necking strain conditions. Even for lower strain levels, the Poisson’s compressive stresses in the y and z directions are not accounted for. The values in Fig.10 only deviate from the original for strains higher than 0.09, where the model is inappropriate. The fact that the failure is shear oriented, means that the shear strains are dominate, not the normal strains. This is also a failing of the modeling effort. There is also a major objection to showing data down to the 0 um level which occurs in some of the analysis plots.
Response: Sorry for the mistake. The nucleation theory including corresponding formulas and statements has been removed. The data involving distances below 3 $\mu$m are also removed.
- The modeling also does not account for the grain boundary influences on pore nucleation and growth. The authors also invoke dislocation mechanisms to help explain nucleation theory, but there are no measurements here.
Response: Thanks for the suggestion. EBSD characterizations on the postmortem irradiated samples have been added to discuss the effects of grain boundaries. The modelling for mode I nucleation has been removed. Clarification has been made in Fig.11, and lines 490–506, pages 32–34.
- The major failing of this paper is that it does not have accompanying microstructural information for the length scales below the synchrotron resolution limit. The paper could be useful if it were combined with a substantial amount of TEM work to look at scales down to the nano-meter range.
Response: Thanks for the suggestion. CT characterization is superior in its 3D and quantitative features, compared to the SEM and TEM which can achieve high resolutions. TEM characterizations on the irradiated sample prior to loading and EBSD characterizations on the postmortem irradiated sample are added in the revised manuscript. See Figs.2 and 11, respectively.
Reference
以 Acta Materialia 期刊为例,Reference 的书写规范中作者名需以逗号隔开,姓名缩写形如 H. W. Chai,文章标题以逗号结尾,期刊名采用 ISO4 标准期刊缩写,结尾需标注期刊刊号,年份,页码信息。
[1] K. Farrell, J. Bentley, D. N. Braski, Direct observation of radiationinduced coated cavities, Scr. Metall. 11 (3) (1977) 243–248.
Declaration of Interests
声明本文作者没有已知的竞争经济利益或个人关系,可能会影响本文中所涉及的科研成果。一般只需在第一条中打勾,如存在竞争关系方,可在第二项中注明。
The authors declare that they have no known competing financial interests or personal relationships that could have appeared to influence the work reported in this paper.
The authors declare the following financial interests/personal relationships which may be considered as potential competing interests.
生成式 AI 使用声明与利益冲突声明不是同一事项。Elsevier 当前政策要求:若作者在写作过程中使用生成式 AI,应在参考文献之前以单独声明披露工具名称和用途;仅用于基础语法、拼写和参考文献检查时通常不要求声明,且 AI 工具不能列为作者。其他出版社的规则可能不同,参见 Elsevier 生成式 AI 政策。